sas A00-240 Exam Questions
Questions for the A00-240 were updated on : Feb 20 ,2026
Page 1 out of 7. Viewing questions 1-15 out of 99
Question 1
After performing an ANOVA test, an analyst has determined that a significant effect exists due to
income. The analyst wants to compare each Income to all others and wants to control for
experimentwise error.
Which GLM procedure statement would provide the most appropriate output?
- A. lsmeans Income / pdiff=control adjust=dunnett;
- B. lsmeans Income / pdiff=control adjust=t;
- C. lsmeans Income / pdiff=all adjust=tukey;
- D. lsmeans Income / pdiff=all adjust=t;
Answer:
A
Question 2
This question will ask you to provide a missing option.
A business analyst is investigating the differences in sales figures across 8 sales regions. The analyst is
interested in viewing the regression equation parameter estimates for each of the design variables.
Which option completes the program to produce the regression equation parameter estimates?
- A. Solve
- B. Estimate
- C. Solution
- D. Est
Answer:
C
Question 3
This question will ask you to provide a missing option.
Given the following SAS program: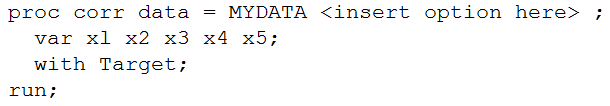
What option must be added to the program to obtain a data set containing Spearman statistics?
- A. OUTCORR=estimates
- B. OUTS=estimates
- C. OUT=estimates
- D. OUTPUT=estimates
Answer:
D
Question 4
This question will ask you to provide a segment of missing code.
The following code is used to create missing value indicator variables for input variables, fred1 to
fred7.
Which segment of code would complete the task?
- A. Option A
- B. Option B
- C. Option C
- D. Option D
Answer:
C
Question 5
What does the Pearson product moment correlation coefficient measure?
- A. nonlinear and nonmonotonic association between two variables
- B. linear and monotonic association between two variables
- C. linear and nonmonotonic association between two variables
- D. nonlinear and monotonic association between two variables
Answer:
B
Question 6
An analyst knows that the categorical predictor, zip_code, is an important predictor of a binary
target. However, zip_code has too many levels to be a feasible predictor in a model. The analyst uses
PROC CLUSTER to implement Greenacre's method to reduce the number of categorical levels.
What is the correct application of Greenacre's method in this situation?
- A. Clustering the levels using the target proportion for each zip_code as input.
- B. Clustering the levels using the zip_code values as input.
- C. Clustering the levels using the number of cases in each zip_code as input.
- D. Clustering the levels using dummy coded zip_code levels as inputs.
Answer:
A
Question 7
DRAG DROP
Drag the adjustment formulas for oversamping from the left and place them into the correct location
in the confusion matrix shown on the right.
Answer:

Question 8
Which statistic is based on the maximum vertical distance between the primary event EDF and the
secondary event EDF?
- A. KS
- B. SBC
- C. Max EDF
- D. Brier Score
Answer:
A
Question 9
Refer to the confusion matrix: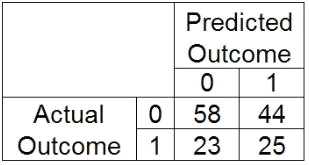
Calculate the accuracy and error rate (0 - negative outcome, 1 - positive outcome)
- A. Accuracy = 58/102, Error Rate = 23/48
- B. Accuracy = 83/102, Error Rate = 67/102
- C. Accuracy = 25/150, Error Rate = 44/150
- D. Accuracy = 83/150, Error Rate = 67/150
Answer:
A
Question 10
Refer to the exhibit:
On the Gains Chart, what is the correct interpretation of the horizontal reference line?
- A. the proportion of cases that cannot be classified
- B. the probability of a false negative
- C. the probability of a false positive
- D. the prior event rate
Answer:
B
Question 11
FILL IN THE BLANK
Refer to the confusion matrix: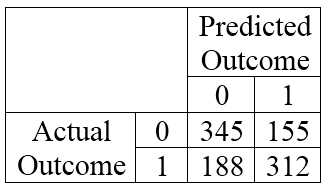
An analyst determines that loan defaults occur at the rate of 3% in the overall population. The above
confusion matrix is from an oversampled test set (1 = default).
What is the sensitivity adjusted for the population event probability?
Enter your answer in the space below. Round to three decimals (example: n.nnn).
Answer:
0.617
Question 12
A researcher has several variables that could be possible predictors for the final model. There is
interest in checking all 2-way interactions for possible entry to the model. The researcher has
decided to use forward selection within PROC LOGISTIC. Fill in the missing code option that will
ensure that all 2-way interactions will be considered for entry.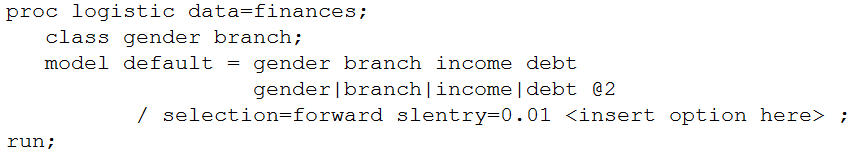
- A. start = 5
- B. include = 4
- C. include = 5
- D. start = 4
Answer:
C
Question 13
What is a benefit to performing data cleansing (imputation, transformations, etc.) on data after
partitioning the data for honest assessment as opposed to performing the data cleansing prior to
partitioning the data?
- A. It makes inference on the model possible.
- B. It is computationally easier and requires less time.
- C. It omits the training (and test) data sets from the benefits of the cleansing methods.
- D. It allows for the determination of the effectiveness of the cleansing method.
Answer:
D
Question 14
Refer to the exhibit:
Which SAS program produced the graph?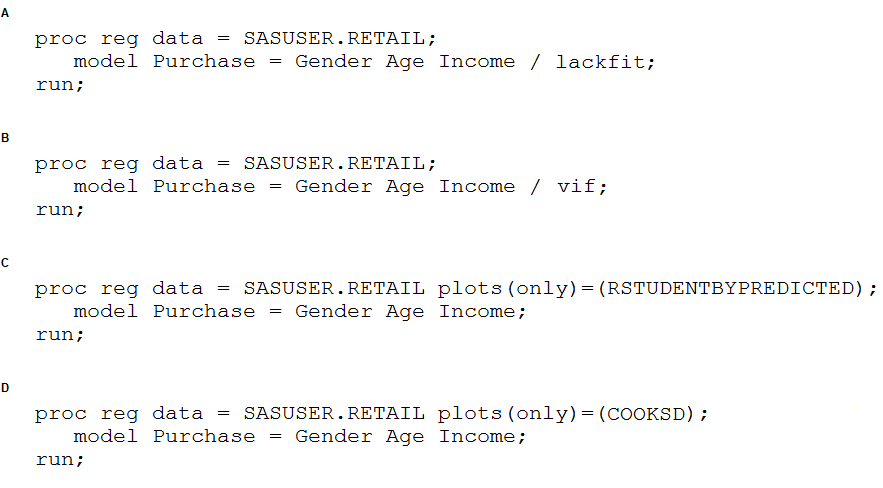
- A. Option A
- B. Option B
- C. Option C
- D. Option D
Answer:
B
Question 15
Refer to the exhibit:
Which statement is true, based on the plots above?
- A. Approximately twice as many customers with the top ten percent of predicted probabilities are expected to have a positive versus negative event.
- B. Approximately ten percent of a randomly selected subset of twenty percent of the customers are expected to have a positive event.
- C. Approximately twenty percent of the customers with a predicted score of 3 have a positive predicted class.
- D. Approximately ten percent of those customers with the top twenty percent of predicted probabilities are expected to have a positive event.
Answer:
A