SAP C-THR92-2505 Exam Questions
Questions for the C-THR92-2505 were updated on : Feb 18 ,2026
Page 1 out of 6. Viewing questions 1-15 out of 80
Question 1
You want to create a page in a canvas report that includes a custom image, a user editable title
centered underneath the image, and the current date in the top-right corner. Which combinations of
components can you use to accomplish this? Note: There are 2 correct answers to this question.
- A. 1 custom image component, 2 rich text components
- B. 1 custom image component, 1 simple text component
- C. 1 custom image component, 1 rich text component
- D. 1 custom image component, 1 rich text component, 1 simple text component
Answer:
A, D
Question 2
You need to create a chart of type Indicator: Numeric Point that displays the following output:
count of employees with the gender male divided by the count of employee with the gender female.
The chart can then be filtered for different departments. What calculation is required to create the
metric?
- A. In Chart Builder, use a calculation of type: Aggregation.
- B. In Query Builder, use a calculated column.
- C. In Chart Builder, use a calculation of type: Calculated Measure.
- D. In Chart Builder, use a calculation of type: Restricted Measure.
Answer:
C
Question 3
You want to create a tile-based dashboard and make it available to users. After you created and
named the dashboard, which steps are required?
- A. Create tiles(s). Select filters. Save dashboard.
- B. Select tile(s). Select dataset. Save dashboard.
- C. Create tile(s). Select dataset. Share dashboard.
- D. Select tile(s). Save dashboard. Share dashboard.
Answer:
D
Question 4
User A schedules a report in Report Center Scheduler What can user A achieve by enabling the Job
Completion notification option for a scheduled job in the Report Center Scheduler?
- A. An e-mail is sent to the recipient of the report that the report distribution process is complete.
- B. A notification appears for user A on the home page after the report distribution process is complete.
- C. An e-mail is sent to user A after the report distribution process is complete.
- D. A notification appears for the recipient of the report on the home page after the report distribution process is complete.
Answer:
C
Question 5
You are working with nested labels on your instance in Report Center.
How do you configure the labels as displayed in the screenshot? Note: There are 2 correct answers to
this question.
- A. Set "Nest label in;" to Recruiting.
- B. Set "Nest label in:" to Talent Management.
- C. Edit the Talent Management label in Manage Labels.
- D. Edit the Recruiting label in Manage Labels.
Answer:
B, D
Question 6
Where can you obtain the latest versions of the standard canvas report templates provided by SAP
SuccessFactors?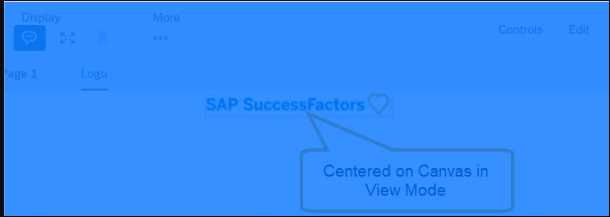
- A. SAP Support Portal
- B. SAP SuccessFactors HCM Cloud Operations Portal
- C. SAP PartnerEdge
- D. SAP Help Portal
Answer:
D
Question 7
In a Story, which of the following would make it possible for a filter to update multiple charts using
linked analysis? Note: There are 2 correct answers to this question.
- A. The chart should use the same aggregation.
- B. The charts should use the same measures.
- C. The charts should have the same data source.
- D. The data sources for the charts should contain linked dimensions.
Answer:
C, D
Question 8
You are creating a Story report on employment and compensation information. You have created two
queries to support the story report. The table and the left chart are using an employment query as its
data source. The right chart uses a compensation query as its data source. Both queries include the
field for the employee Job Title. When you add an input control to the page, it only filters the table
and the left chart. What action must you take to configure the input control to effect both charts and
the table?
- A. Convert it to a Story Filter.
- B. Update Linked Analysis.
- C. Enable Cascading Effects.
- D. Set up Linked Dimensions.
Answer:
D
Question 9
You are creating a Story report on Job Classifications. You have configured the chart, table, and input
control on the canvas, as displayed in the screenshot. How do you set the input control?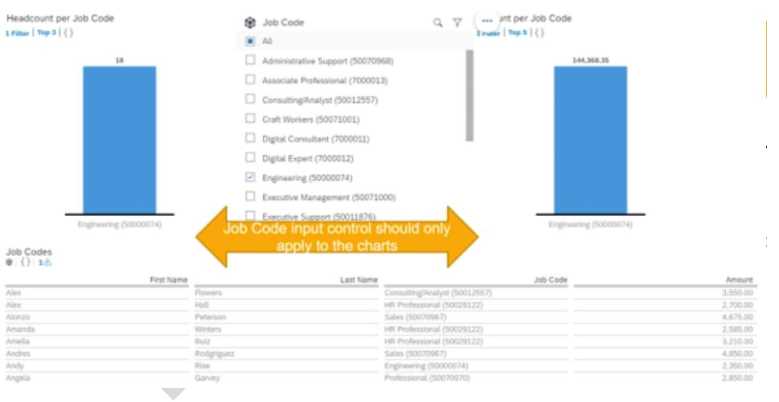
- A. Configure it for Linked Analysis.
- B. Create the corresponding filter on each chart.
- C. Enable Cascading Effects.
- D. Convert it to a Story Filter.
Answer:
A
Question 10
The data source used by the two tables only displays current (active) employees. How would you
configure a filter on the table End of Previous Year Headcount by Location to display data accurately?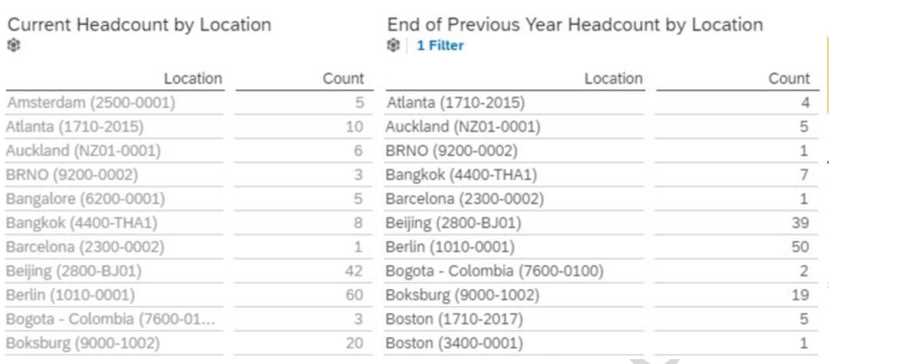
Note: There are 2 correct answers to this question.
- A. Set the Range type to Standard.
- B. Set a filter on Hire Date (Range).
- C. Set a filter on Hire Date (Member).
- D. Set the Range type to Offset.
Answer:
B, D
Question 11
An administrator creates a new MDF object for storing attachments related to an employee's
dependents. After uploading some test data, the administrator states they are unable to report on
the new data with Advanced Reporting tool in a canvas report. The administrator is working for a
client that has already had their system transitioned to Workforce Analytics on SAP HAN
- A. Use WFA on HANA Data Factory to rebuild the cube.
- B. Use Refresh Analytics Permissions Tool.
- C. Request a Metadata Refresh from SAP SuccessFactors Support.
- D. Use Purge Advanced Reporting Metadata Cache Tool.
Answer:
D
Question 12
When a user builds a query, what is the default People Scope of the query?
- A. Direct Reports of the logged-in user
- B. The HR reports of the logged-in user
- C. All Reports of the logged-in user
- D. All employees in the department of the logged-in user
Answer:
A
Question 13
Why would you export report definitions? Note: There are 2 correct answers to this question.
- A. To move reports between company instances
- B. To schedule reports for offline execution
- C. To support report version control
- D. To distribute reports to report consumers
Answer:
A, C
Question 14
What is a prerequisite for using the SuccessFactors standard canvas report templates?
- A. The templates must have been downloaded from the Success Store.
- B. The customer must have enabled the templates in Provisioning.
- C. The customer must have licensed SuccessFactors Employee Central
- D. The templates must have been loaded within Report Center.
Answer:
B
Question 15
When you share a canvas report, from where can the user access that report? Note: There are 2
correct answers to this question.
- A. Reporting Menu
- B. Home Page
- C. Metrics Panel
- D. Report Center
Answer:
A, D