microsoft PL-300 Exam Questions
Questions for the PL-300 were updated on : Jul 20 ,2024
Page 1 out of 23. Viewing questions 1-10 out of 224
Question 1
Note: This question is part of a series of questions that present the same scenario. Each question in the series contains a unique solution that might meet the stated goals. Some question sets might have more than one correct solution, while others might not have a correct solution.
After you answer a question in this section, you will NOT be able to return to it. As a result, these questions will not appear in the review screen.
You have a Power BI report that imports a date table and a sales table from an Azure SQL database data source. The sales table has the following date foreign keys:
Due Date
Order Date
Delivery Date
You need to support the analysis of sales over time based on all the date foreign keys.
Solution: For each date foreign key, you add inactive relationships between the sales table and the date table.
Does this meet the goal?
- A. Yes
- B. No
Answer:
b
Instead: Solution: From the Fields pane, you rename the date table as Due Date. You use a DAX expression to create Order Date and Delivery Date as calculated tables.
Reference:
https://docs.microsoft.com/en-us/power-bi/guidance/relationships-active-inactive
Question 2
DRAG DROP You have a Microsoft Excel spreadsheet named Excel1 that contains survey results.
You have a Power BI dashboard named DashboardA that has Q&A enabled.
You need to ensure that users who can access DashboardA can ask questions based on the contents of Excel1 and pin visuals based on their queries to
DashboardA. The solution must minimize development time.
Which three actions should you perform in sequence? To answer, move the appropriate actions from the list of actions to the answer area and arrange them in the correct order.
Select and Place: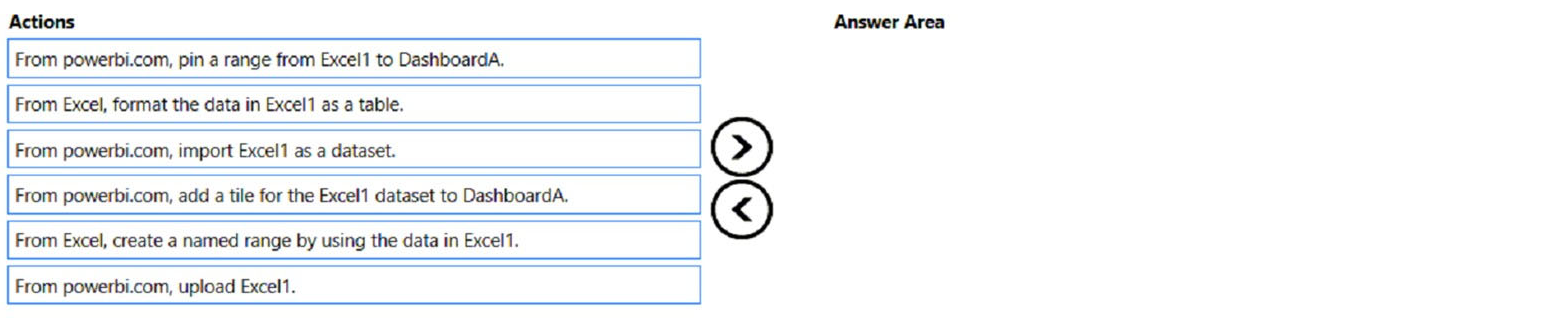
Answer:
None
Step 1: From powerbi.com, upload Excel1.
Upload your Excel file to the Power BI service.
The Power BI service connects to many data sources, including Excel files that live on your computer.
1. Sign in to the Power BI service.
2. In My workspace, select New > Upload a file.
3. Select Local File, browse to where you saved the Financial Sample Excel file, and select Open.
4. On the Local File page, select Import.
Now you have a Financial Sample dataset. Power BI also automatically created a blank dashboard. If you don't see the dashboard, refresh your browser.
Step 2: From powerbi.com, import Excel1 as a dataset.
Step 3: From powerbi.com, add a tile for the Excel1 dataset to DashboarA.
Reference:
https://docs.microsoft.com/en-us/power-bi/create-reports/service-from-excel-to-stunning-report
Question 3
DRAG DROP
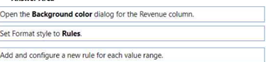
You have a Power BI report that contains a table visual with a measure named Revenue. The Revenue measure returns values within a range of 0 to 5.
You need to format the visual so that the Revenue column displays a specific background color based on the value range shown in the following table.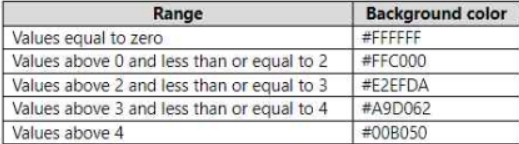
Which three actions should you perform in sequence in Power BI Desktop? To answer, move the appropriate actions from the list of actions to the answer area and arrange them in the correct order.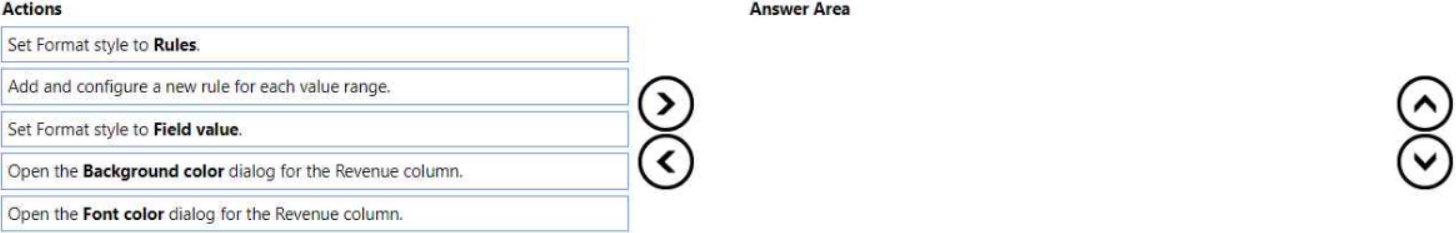
Answer:
None
Question 4
DRAG DROP
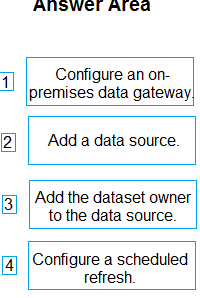
You publish a dataset that contains data from an on-premises Microsoft SQL Server database.
The dataset must be refreshed daily.
You need to ensure that the Power BI service can connect to the database and refresh the dataset.
Which four actions should you perform in sequence? To answer, move the appropriate actions from the list of actions to the answer area and arrange them in the correct order.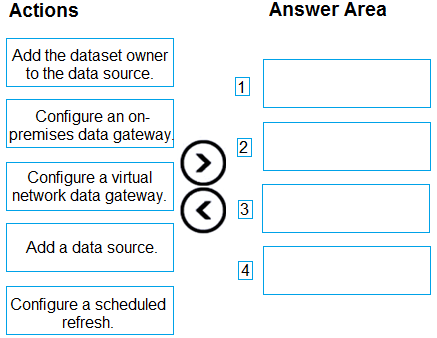
Answer:
None
Question 5
You need to create the relationship between the product list and the revenue results. The solution must minimize the time it takes to render visuals.
What should you set as the relationship cardinality?
- A. One to one
- B. Many to many
- C. Many to one
- D. One to many
Answer:
d
One product in the product list can occur many times in the revenue results.
Note 1: One to many (1:*): In a one-to-many relationship, the column in one table has only one instance of a particular value, and the other related table can have more than one instance of a value.
Note 2:
Revenue data is provided at the date and product level.
The board must be able to get the following information from the quarterly reports:
Revenue trends over time -
The percent of total revenue contributed by each product category
A comparison of quarterly revenue versus the same quarter from the previous year
Reference:
https://docs.microsoft.com/en-us/power-bi/transform-model/desktop-create-and-manage-relationships
Question 6
You have a Microsoft Power BI report. The size of PBIX file is 550 MB. The report is accessed by using an App workspace in shared capacity of powerbi.com.
The report uses an imported dataset that contains one fact table. The fact table contains 12 million rows. The dataset is scheduled to refresh twice a day at 08:00 and 17:00.
The report is a single page that contains 15 AppSource visuals and 10 default visuals.
Users say that the report is slow to load the visuals when they access and interact with the report.
You need to recommend a solution to improve the performance of the report.
What should you recommend?
- A. Implement row-level security (RLS).
- B. Remove unused columns from tables in the data model.
- C. Replace the default visuals with AppSource visuals.
- D. Enable visual interactions.
Answer:
b
Question 7
You have a Power BI report. The report contains a visual that shows gross sales by date. The visual has anomaly detection enabled.
No anomalies are detected.
You need to increase the likelihood that anomaly detection will identify anomalies in the report.
What should you do?
- A. Increase the Expected range transparency setting.
- B. Add a data field to the Legend field well.
- C. Increase the Sensitivity setting.
- D. Add a data field to the Secondary values field well.
Answer:
a
Adding anomaly detection automatically enriches the chart with anomalies, and the expected range of values. When a value goes outside this expected boundary, it's marked as an anomaly.
Reference:
https://docs.microsoft.com/en-us/power-bi/visuals/power-bi-visualization-anomaly-detection
Question 8
DRAG DROP You have a folder that contains 100 CSV files.
You need to make the file metadata available as a single dataset by using Power BI. The solution must NOT store the data of the CSV files.
Which three actions should you perform in sequence. To answer, move the appropriate actions from the list of actions to the answer area and arrange them in the correct order.
Select and Place: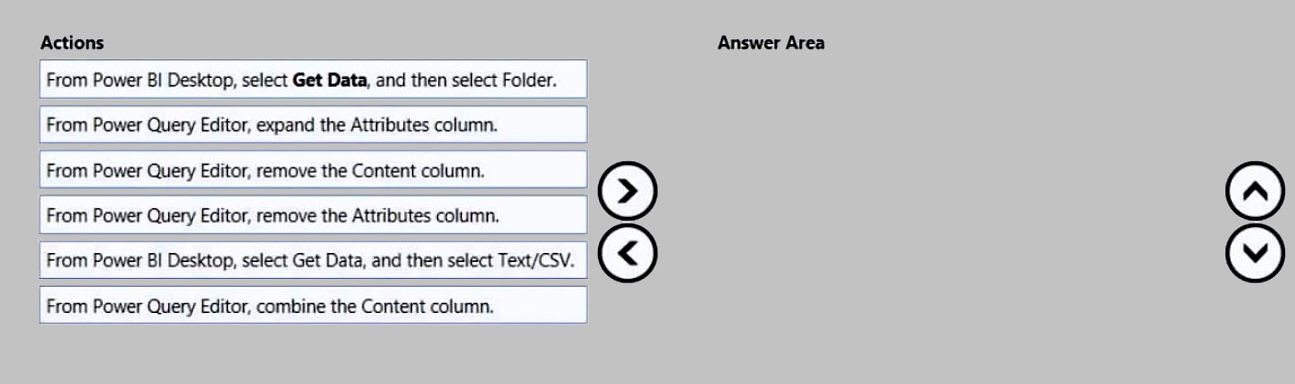
Answer:
None
Step 1: From Power BI Desktop, Select Get Data, and then Select Folder.
Open Power BI Desktop and then select Get Data\More and choose Folder from the All options on the left.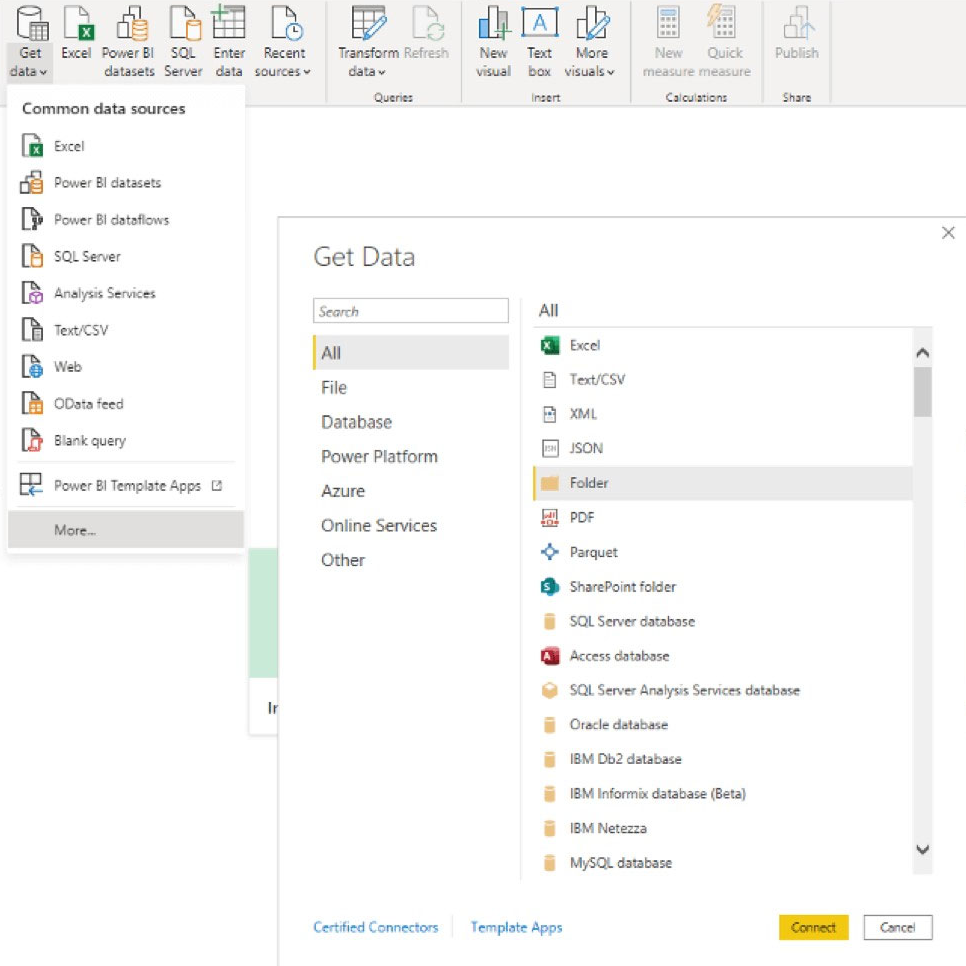
Enter the folder path, select OK, and then select Transform data to see the folder's files in Power Query Editor.
Step 2: From Power Query Editor, expand the Attributes column.
Step 3: From Power Query Editor, combine the Content column.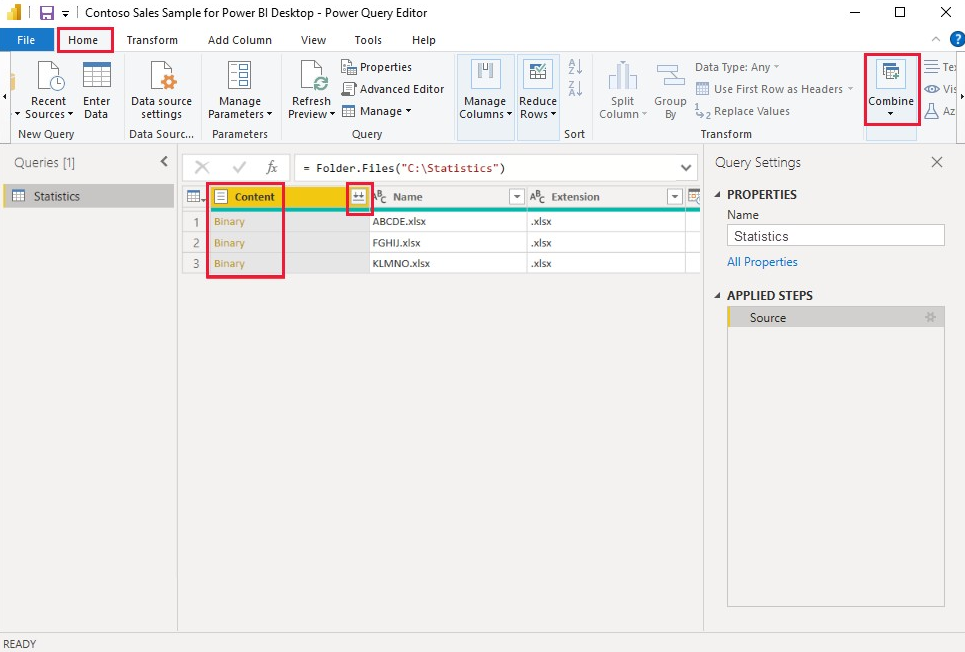
Combine files behavior -
To combine binary files in Power Query Editor, select Content (the first column label) and select Home > Combine Files. Or you can just select the Combine Files icon next to Content.
Reference:
https://docs.microsoft.com/en-us/power-bi/transform-model/desktop-combine-binaries
Question 9
You need to update the Power BI model to ensure that the analysts can quickly build drill-downs from business unit to product in a visual.
What should you create?
- A. a group
- B. a calculated table
- C. a hierarchy
- D. a calculated column
Answer:
c
Drill requires a hierarchy.
When a visual has a hierarchy, you can drill down to reveal additional details.
Reference:
https://docs.microsoft.com/en-us/power-bi/consumer/end-user-drill
Question 10
You have a Power BI data model that contains a table named Employees. The table has the following columns:
Employee Name
Email Address
Start Date
Job Title
You are implementing dynamic row-level security (RLS).
You need to create a table filter to meet the following requirements:
Users must see only their own employee data.
The DAX expression must work in both Power BI Desktop and the Power BI service.
Which expression should you use?
- A. [Employee Name] = USERPRINCIPALNAME()
- B. [Email Address] = USERNAME()
- C. [Employee Name] = USERNAME()
- D. [Email Address] = USERPRINCIPALNAME()
Answer:
d