microsoft DP-900 Exam Questions
Questions for the DP-900 were updated on : Jul 07 ,2025
Page 1 out of 11. Viewing questions 1-15 out of 156
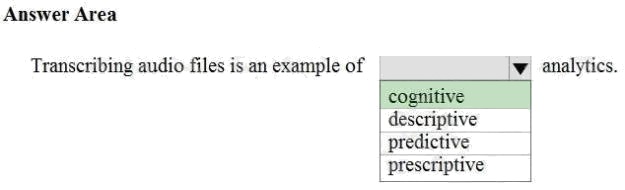
Question 1 Topic 1, Describe core data concepts
HOTSPOT
To complete the sentence, select the appropriate option in the answer area.
Hot Area: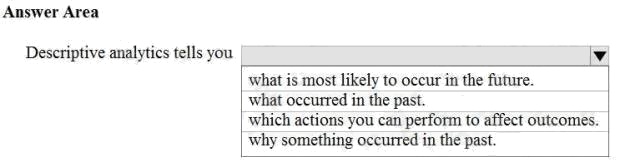
Answer:
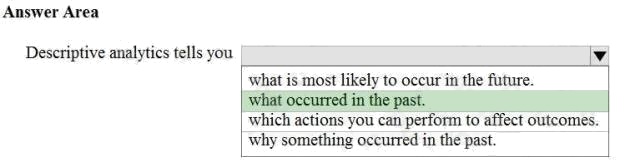
Explanation:
Reference: https://demand-planning.com/2020/01/20/the-differences-between-descriptive-diagnostic-predictive-cognitive-
analytics/
Question 2 Topic 1, Describe core data concepts
HOTSPOT
For each of the following statements, select Yes if the statement is true. Otherwise, select No.
NOTE: Each correct selection is worth one point.
Hot Area: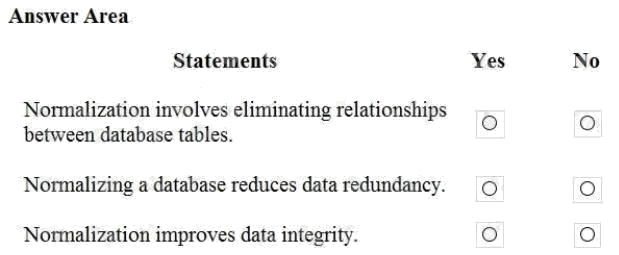
Answer:
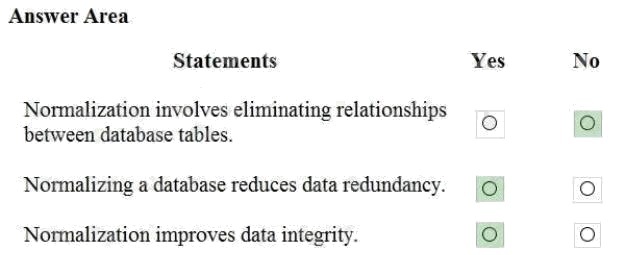
Explanation:
Reference: https://www.sqlshack.com/what-is-database-normalization-in-sql-server/
Question 3 Topic 1, Describe core data concepts
HOTSPOT
To complete the sentence, select the appropriate option in the answer area.
Hot Area: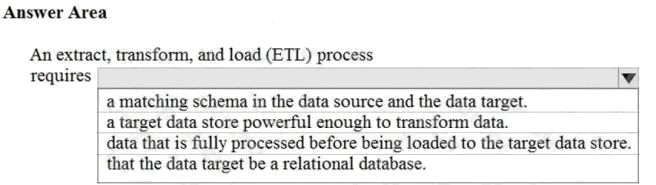
Answer:
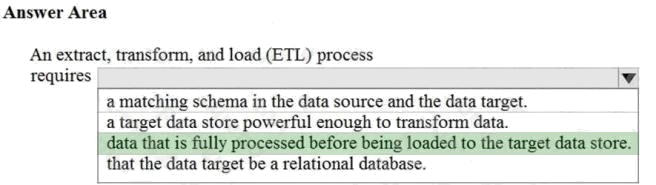
Explanation:
Extract, transform, and load (ETL) is a data pipeline used to collect data from various sources, transform the data according
to business rules, and load it into a destination data store.
Reference: https://docs.microsoft.com/en-us/azure/architecture/data-guide/relational-data/etl
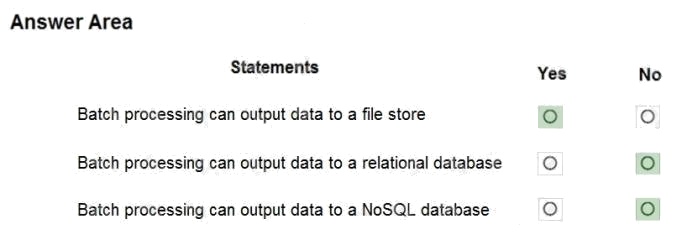
Question 4 Topic 1, Describe core data concepts
HOTSPOT
To complete the sentence, select the appropriate option in the answer area.
Hot Area: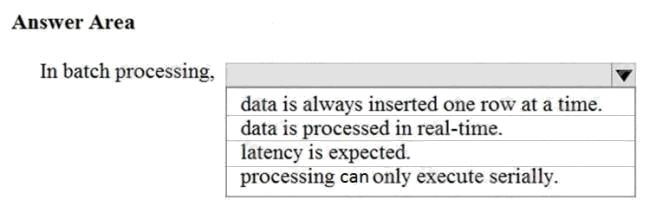
Answer:
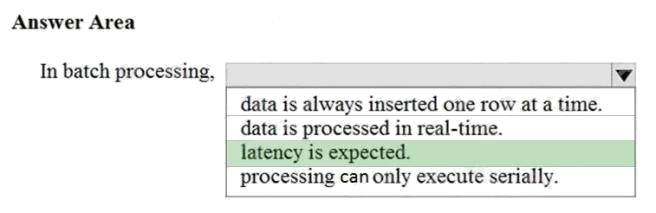
Explanation:
Reference: https://www.bmc.com/blogs/what-is-batch-processing-batch-processing-explained/
Question 5 Topic 1, Describe core data concepts
HOTSPOT
To complete the sentence, select the appropriate option in the answer area.
Hot Area: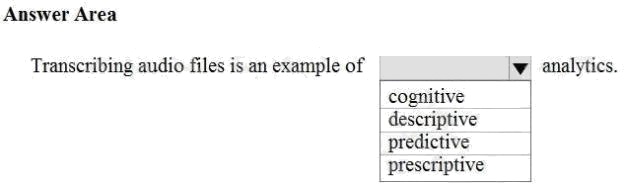
Answer:
Explanation:
Reference: https://azure.microsoft.com/en-us/services/cognitive-services/speech-services/
Question 6 Topic 1, Describe core data concepts
DRAG DROP
Match the types of analytics that can be used to answer the business questions.
To answer, drag the appropriate analytics type from the column on the left to its question on the right. Each analytics type
may be used once, more than once, or not at all.
NOTE: Each correct match is worth one point.
Select and Place: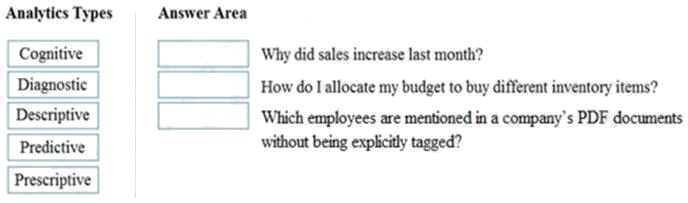
Answer:
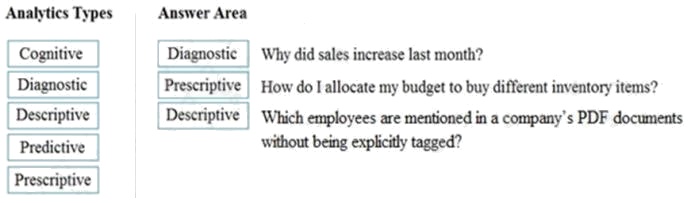
Incorrect Predictive analytics, broadly speaking, is a category of business intelligence that uses
descriptive and predictive variables from the past to analyze and identify the likelihood of an unknown future
Descriptive, to answer the
Whys happening? Predictive, to answer the
What actions should we take?
Reference: https://demand-planning.com/2020/01/20/the-differences-between-descriptive-diagnostic-predictive-
cognitive-analytics/ https://azure.microsoft.com/en-us/blog/answering-whats-happening-whys-happening-and-
what-will-happen-with-iot-analytics/
Explanation:
Box 1: Diagnostic
Diagnostic Analytics: At this stage you can begin to answer some of those why questions. Historical data can begin to be
measured against other data to answer the question of why something happened in the past. This is the process of gathering
and interpreting different data sets to identify anomalies, detect patters, and determine relationships.
Box 2: Prescriptive
Prescriptive analytics is a combination of data, mathematical models, and various business rules to infer actions to influence
future desired outcomes.
Answer: Incorrect
Predictive analytics, broadly speaking, is a category of business intelligence that uses descriptive and predictive variables
from the past to analyze and identify the likelihood of an unknown future outcome
Box 3: Descriptive
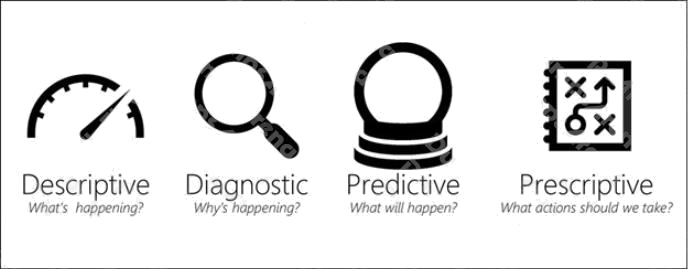
Generally speaking, data analytics comes in four types:
Descriptive, to answer the question: Whats happening?
Diagnostic, to answer the question: Whys happening?
Predictive, to answer the question: What will happen?
Prescriptive, to answer the question: What actions should we take?
Reference: https://demand-planning.com/2020/01/20/the-differences-between-descriptive-diagnostic-predictive-cognitive-
analytics/ https://azure.microsoft.com/en-us/blog/answering-whats-happening-whys-happening-and-what-will-happen-with-
iot-analytics/
Question 7 Topic 1, Describe core data concepts
HOTSPOT
You have the following JSON document.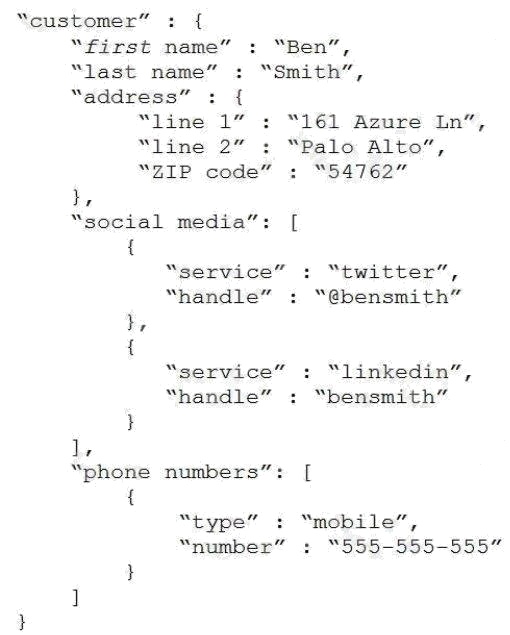
Use the drop-down menus to select the answer choice that completes each statement based on the information presented in
the JSON document.
NOTE: Each correct selection is worth one point.
Hot Area:
Answer:
Explanation:
Reference: https://www.w3schools.com/js/js_json_arrays.asp https://www.w3schools.com/js/js_json_objects.asp
Question 8 Topic 1, Describe core data concepts
HOTSPOT
You are reviewing the data model shown in the following exhibit.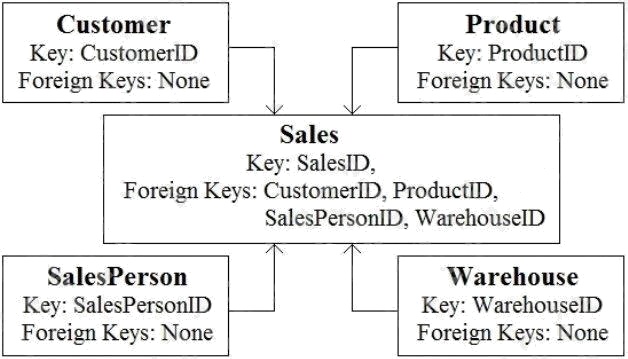
Use the drop-down menus to select the answer choice that completes each statement based on the information presented in
the graphic. NOTE: Each correct selection is worth one point
Hot Area:
Answer:
Explanation:
Box 1: star schema
In computing, the star schema is the simplest style of data mart schema and is the approach most widely used to develop
data warehouses and dimensional data marts. The star schema consists of one or more fact tables referencing any number
of dimension tables. The star schema is an important special case of the snowflake schema, and is more effective for
handling simpler queries.
Example: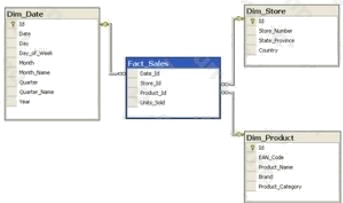
Incorrect Answers:
The data in the question is not normalized.
The snowflake schema is a variation of the star schema, featuring normalization of dimension tables. Example: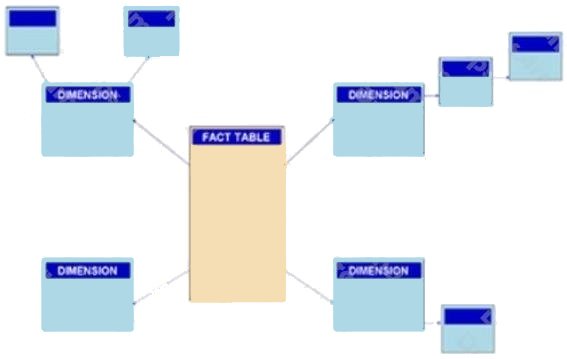
Note: A snowflake schema is a logical arrangement of tables in a multidimensional database such that the entity relationship
diagram resembles a snowflake shape. The snowflake schema is represented by centralized fact tables which are connected
to multiple dimensions.[citation needed]. "Snowflaking" is a method of normalizing the dimension tables in a star schema.
When it is completely normalized along all the dimension tables, the resultant structure resembles a snowflake with the fact
table in the middle.
Box 2: dimension
The star schema consists of one or more fact tables referencing any number of dimension tables.
Reference:
https://docs.microsoft.com/en-us/azure/synapse-analytics/sql-data-warehouse/sql-data-warehouse-tables-overview
https://en.wikipedia.org/wiki/Star_schema https://en.wikipedia.org/wiki/Snowflake_schema https://azure.microsoft.com/en-
us/blog/data-models-within-azure-analysis-services-and-power-bi/
Question 9 Topic 1, Describe core data concepts
HOTSPOT
To complete the sentence, select the appropriate option in the answer area.
Hot Area: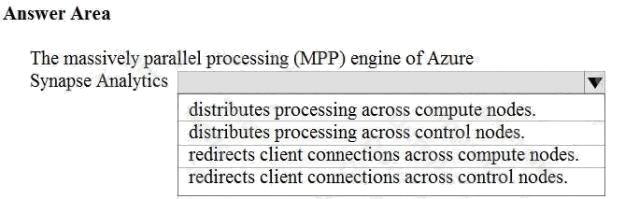
Answer:
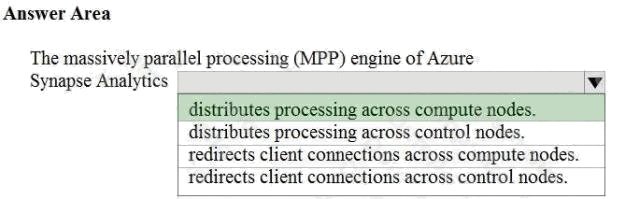
Explanation:
Reference: https://docs.microsoft.com/en-us/azure/synapse-analytics/sql-data-warehouse/massively-parallel-processing-
mpp-architecture
Question 10 Topic 1, Describe core data concepts
HOTSPOT
To complete the sentence, select the appropriate option in the answer area.
Hot Area: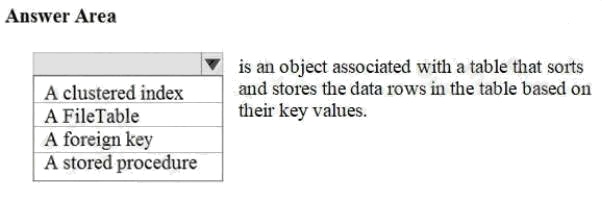
Answer:
Explanation:
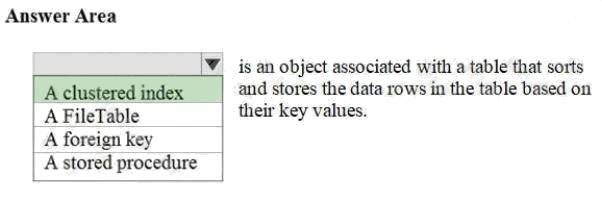
Reference: https://docs.microsoft.com/en-us/sql/relational-databases/indexes/clustered-and-nonclustered-indexes-
described?view=sql-server-ver15
Question 11 Topic 1, Describe core data concepts
HOTSPOT
To complete the sentence, select the appropriate option in the answer area.
Hot Area: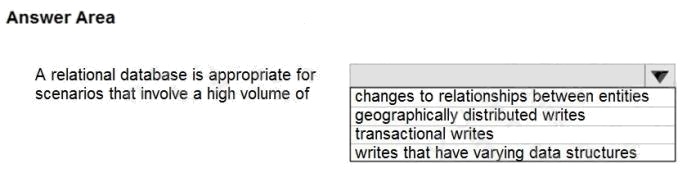
Answer:
Explanation:
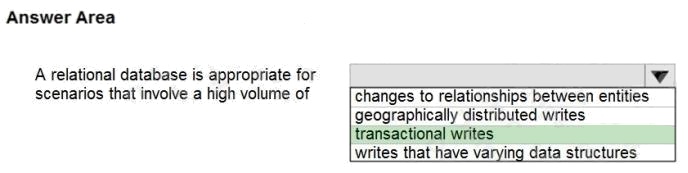
Disadvantages of non-relational databases include: Data Consistency non-relational databases do not perform ACID
transactions.
Note: Relational databases are optimized for writes. They are optimized for consistency and availability. Advantages of
relational databases include simplicity, ease of data retrieval, data integrity, and flexibility.
Incorrect Answers:
Use a relational database when data that you work with is structured, and the structure is not subject to frequent changes.
Use Cloud storage (no relational database) for geographically distributed writes.
Reference: https://towardsdatascience.com/choosing-the-right-database-c45cd3a28f77
Question 12 Topic 1, Describe core data concepts
HOTSPOT
For each of the following statements, select Yes if the statement is true. Otherwise, select No.
NOTE: Each correct selection is worth one point.
Hot Area: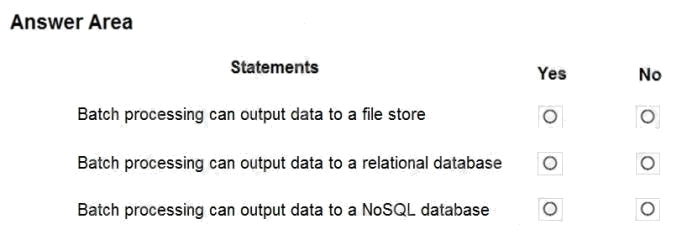
Answer:
Explanation:
Box 1: Yes
Big data solutions often use long-running batch jobs to filter, aggregate, and otherwise prepare the data for analysis. Usually
these jobs involve reading source files from scalable storage (like HDFS, Azure Data Lake Store, and Azure Storage),
processing them, and writing the output to new files in scalable storage.
Box 2: No
Box 3: No
Reference:
https://docs.microsoft.com/en-us/azure/architecture/data-guide/big-data/batch-processing
Question 13 Topic 1, Describe core data concepts
DRAG DROP Your company plans to load data from a customer relationship management (CRM) system to a data
warehouse by using an extract, load, and transform (ELT) process.
Where does data processing occur for each stage of the ELT process? To answer, drag the appropriate locations to the
correct stages. Each location may be used once, more than once, or not at all. You may need to drag the split bar between
panes or scroll to view content.
NOTE: Each correct selection is worth one point.
Select and Place: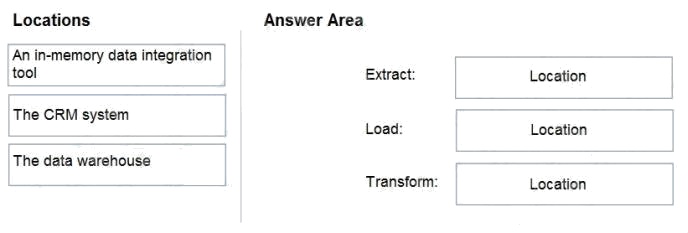
Answer:
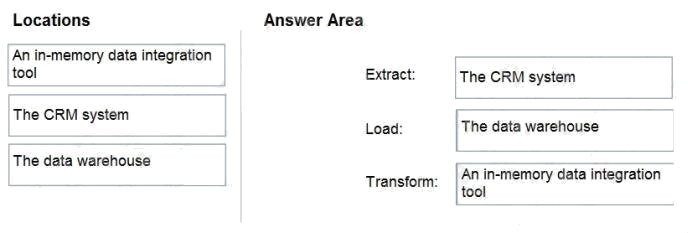
Explanation:
Box 1: The CRM system
Data is extracted from the CRM system.
Box 2: The data warehouse
Data is loaded to the data warehouse.
Box 3: An in-memory data integration tool
The data transformation that takes place usually involves various operations, such as filtering, sorting, aggregating, joining
data, cleaning data, deduplicating, and validating data.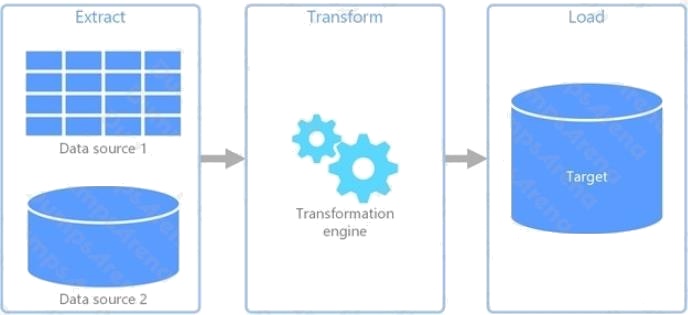
Reference:
https://docs.microsoft.com/en-us/azure/architecture/data-guide/relational-data/etl
Question 14 Topic 1, Describe core data concepts
HOTSPOT
To complete the sentence, select the appropriate option in the answer area.
Hot Area: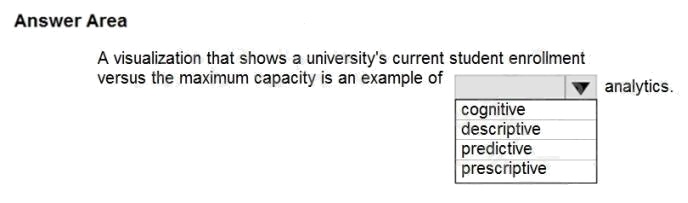
Answer:
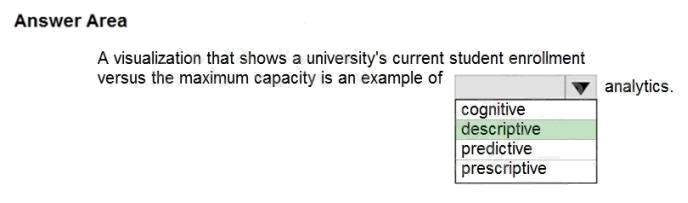
Explanation:
Generally speaking, data analytics comes in four types (Figure 1):
Descriptive, to answer the question: Whats happening?
Diagnostic, to answer the question: Whys happening?
Predictive, to answer the question: What will happen?
Prescriptive, to answer the question: What actions should we take?
Reference:
https://azure.microsoft.com/en-us/blog/answering-whats-happening-whys-happening-and-what-will-happen-with-iot-analytics/
Question 15 Topic 1, Describe core data concepts
DRAG DROP
Match the types of visualizations to the appropriate descriptions.
To answer, drag the appropriate visualization type from the column on the left to its description on the right. Each
visualization type may be used once, more than once, or not at all.
NOTE: Each correct match is worth one point.
Select and Place: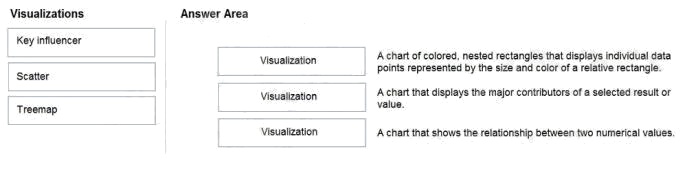
Answer:
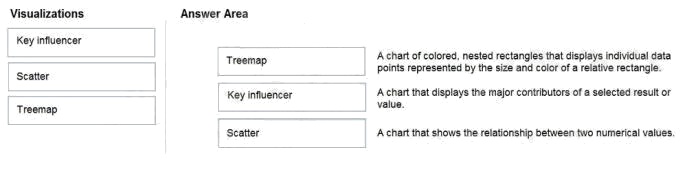
Explanation:
Box 1: Tree map
Treemaps are charts of colored rectangles, with size representing value. They can be hierarchical, with rectangles nested
within the main rectangles.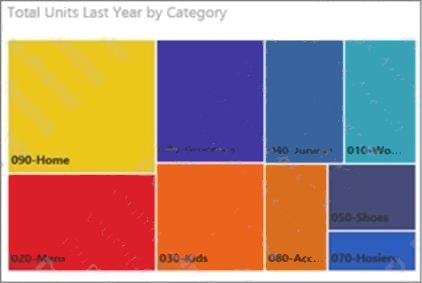
Box 2: Key influencer
A key influencer chart displays the major contributors to a selected result or value.
Box 3: Scatter
Scatter and Bubble charts display relationships between 2 (scatter) or 3 (bubble) quantitative measures -- whether or not, in
which order, etc.