microsoft DP-100 Exam Questions
Questions for the DP-100 were updated on : Jul 06 ,2025
Page 1 out of 20. Viewing questions 1-15 out of 294
Question 1 Topic 1, Case Study 1Case Study Question View Case
You need to implement a scaling strategy for the local penalty detection data.
Which normalization type should you use?
- A. Streaming
- B. Weight
- C. Batch
- D. Cosine
Answer:
C
Explanation:
Post batch normalization statistics (PBN) is the Microsoft Cognitive Toolkit (CNTK) version of how to evaluate the population
mean and variance of Batch Normalization which could be used in inference Original Paper.
In CNTK, custom networks are defined using the BrainScriptNetworkBuilder and described in the CNTK network description
language "BrainScript."
Scenario:
Local penalty detection models must be written by using BrainScript.
Reference:
https://docs.microsoft.com/en-us/cognitive-toolkit/post-batch-normalization-statistics
Question 2 Topic 1, Case Study 1Case Study Question View Case
HOTSPOT
You need to use the Python language to build a sampling strategy for the global penalty detection models.
How should you complete the code segment? To answer, select the appropriate options in the answer area.
NOTE: Each correct selection is worth one point.
Hot Area: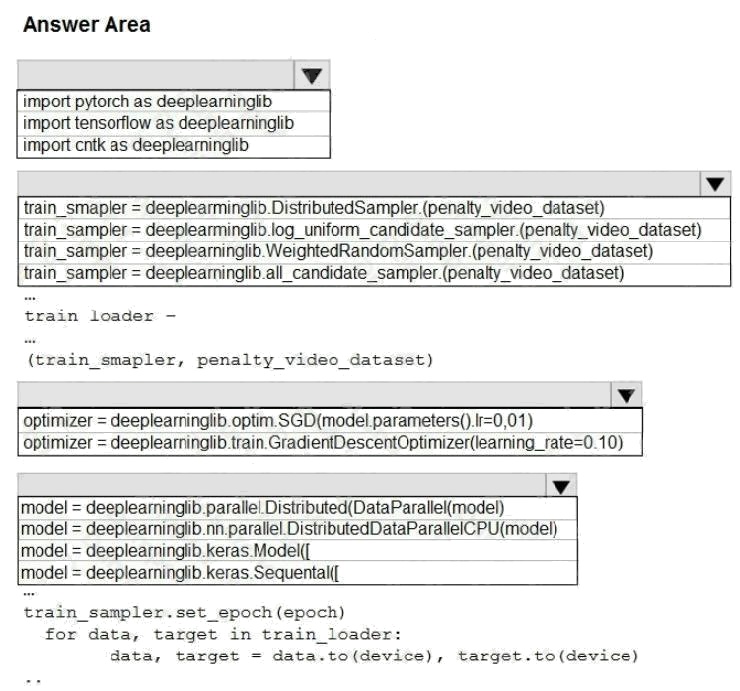
Answer:
Explanation:
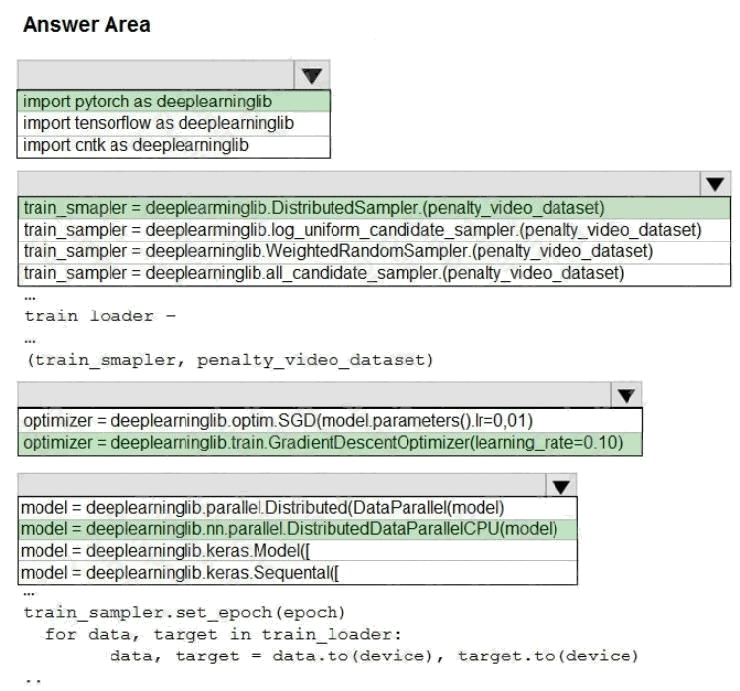
Box 1: import pytorch as deeplearninglib
Box 2: ..DistributedSampler(Sampler)..
DistributedSampler(Sampler):
Sampler that restricts data loading to a subset of the dataset.
It is especially useful in conjunction with class:`torch.nn.parallel.DistributedDataParallel`. In such case, each process can
pass a DistributedSampler instance as a DataLoader sampler, and load a subset of the original dataset that is exclusive to it.
Scenario: Sampling must guarantee mutual and collective exclusively between local and global segmentation models that
share the same features. Box 3: optimizer = deeplearninglib.train. GradientDescentOptimizer(learning_rate=0.10)
Incorrect Answers: ..SGD..
Scenario: All penalty detection models show inference phases using a Stochastic Gradient Descent (SGD) are running too
slow.
Box 4: .. nn.parallel.DistributedDataParallel..
DistributedSampler(Sampler): The sampler that restricts data loading to a subset of the dataset.
It is especially useful in conjunction with :class:`torch.nn.parallel.DistributedDataParallel`.
References:
https://github.com/pytorch/pytorch/blob/master/torch/utils/data/distributed.py
Prepare data for modeling
Question 3 Topic 1, Case Study 1Case Study Question View Case
DRAG DROP
You need to define an evaluation strategy for the crowd sentiment models.
Which three actions should you perform in sequence? To answer, move the appropriate actions from the list of actions to the
answer area and arrange them in the correct order.
Select and Place: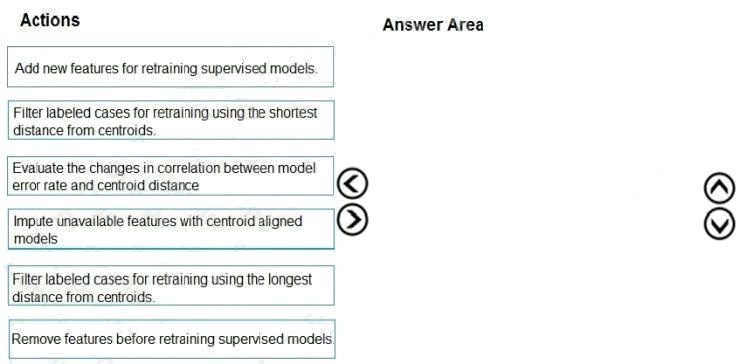
Answer:
Explanation:
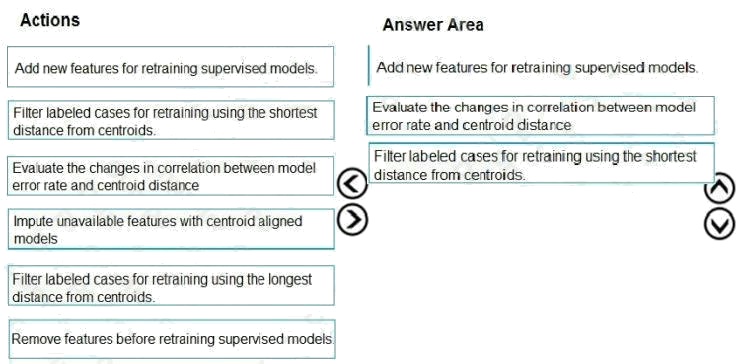
Scenario:
Experiments for local crowd sentiment models must combine local penalty detection data.
Crowd sentiment models must identify known sounds such as cheers and known catch phrases. Individual crowd sentiment
models will detect similar sounds.
Note: Evaluate the changed in correlation between model error rate and centroid distance
In machine learning, a nearest centroid classifier or nearest prototype classifier is a classification model that assigns to
observations the label of the class of training samples whose mean (centroid) is closest to the observation.
References: https://en.wikipedia.org/wiki/Nearest_centroid_classifier https://docs.microsoft.com/en-us/azure/machine-
learning/studio-module-reference/sweep-clustering
Question 4 Topic 1, Case Study 1Case Study Question View Case
You need to implement a feature engineering strategy for the crowd sentiment local models.
What should you do?
- A. Apply an analysis of variance (ANOVA).
- B. Apply a Pearson correlation coefficient.
- C. Apply a Spearman correlation coefficient.
- D. Apply a linear discriminant analysis.
Answer:
D
Explanation:
The linear discriminant analysis method works only on continuous variables, not categorical or ordinal variables.
Linear discriminant analysis is similar to analysis of variance (ANOVA) in that it works by comparing the means of the
variables.
Scenario:
Data scientists must build notebooks in a local environment using automatic feature engineering and model building in
machine learning pipelines. Experiments for local crowd sentiment models must combine local penalty detection data. All
shared features for local models are continuous variables.
Incorrect Answers:
B: The Pearson correlation coefficient, sometimes called Pearson's R test, is a statistical value that measures the linear
relationship between two variables. By examining the coefficient values, you can infer something about the strength of the
relationship between the two variables, and whether they are positively correlated or negatively correlated.
C: Spearman's correlation coefficient is designed for use with non-parametric and non-normally distributed data. Spearman's
coefficient is a nonparametric measure of statistical dependence between two variables, and is sometimes denoted by the
Greek letter rho. The Spearman's coefficient expresses the degree to which two variables are monotonically related. It is
also called Spearman rank correlation, because it can be used with ordinal variables.
Reference:
https://docs.microsoft.com/en-us/azure/machine-learning/studio-module-reference/fisher-linear-discriminant-analysis
https://docs.microsoft.com/en-us/azure/machine-learning/studio-module-reference/compute-linear-correlation
Question 5 Topic 1, Case Study 1Case Study Question View Case
DRAG DROP
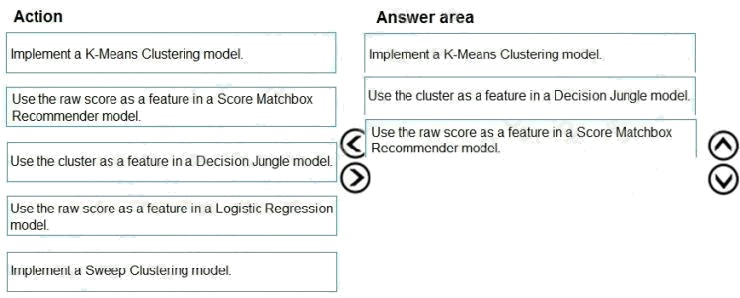
You need to define a modeling strategy for ad response.
Which three actions should you perform in sequence? To answer, move the appropriate actions from the list of actions to the
answer area and arrange them in the correct order.
Select and Place: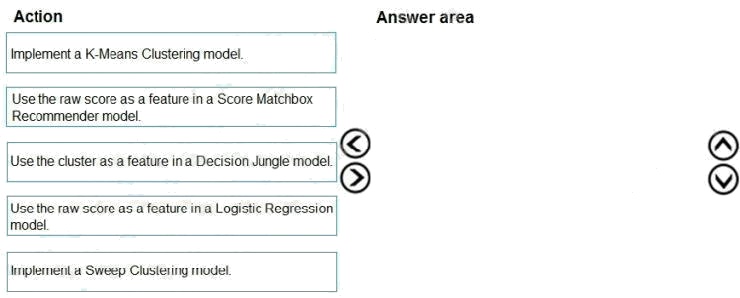
Answer:
Explanation:
Step 1: Implement a K-Means Clustering model
Step 2: Use the cluster as a feature in a Decision jungle model.
Decision jungles are non-parametric models, which can represent non-linear decision boundaries.
Step 3: Use the raw score as a feature in a Score Matchbox Recommender model
The goal of creating a recommendation system is to recommend one or more "items" to "users" of the system. Examples of
an item could be a movie, restaurant, book, or song. A user could be a person, group of persons, or other entity with item
preferences.
Scenario:
Ad response rated declined.
Ad response models must be trained at the beginning of each event and applied during the sporting event.
Market segmentation models must optimize for similar ad response history. Ad response models must support non-linear
boundaries of features.
References: https://docs.microsoft.com/en-us/azure/machine-learning/studio-module-reference/multiclass-decision-jungle
https://docs.microsoft.com/en-us/azure/machine-learning/studio-module-reference/score-matchbox-recommender
Question 6 Topic 1, Case Study 1Case Study Question View Case
DRAG DROP
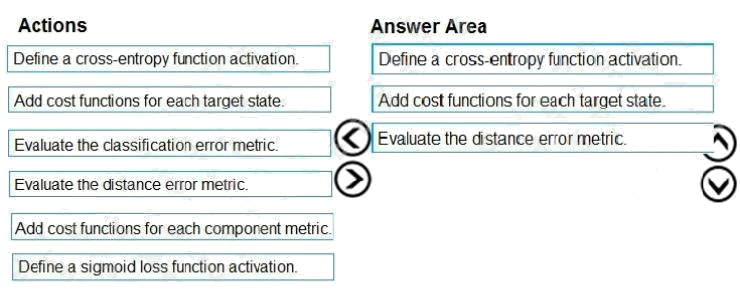
You need to define an evaluation strategy for the crowd sentiment models.
Which three actions should you perform in sequence? To answer, move the appropriate actions from the list of actions to the
answer area and arrange them in the correct order.
Select and Place: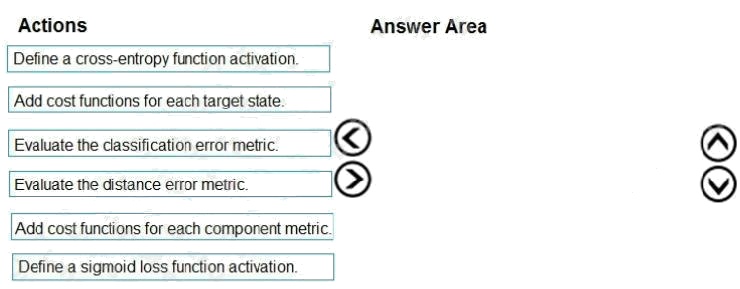
Answer:
Explanation:
Step 1: Define a cross-entropy function activation
When using a neural network to perform classification and prediction, it is usually better to use cross-entropy error than
classification error, and somewhat better to use crossentropy error than mean squared error to evaluate the quality of the
neural network.
Step 2: Add cost functions for each target state.
Step 3: Evaluated the distance error metric.
References: https://www.analyticsvidhya.com/blog/2018/04/fundamentals-deep-learning-regularization-techniques/
Question 7 Topic 1, Case Study 1Case Study Question View Case
You need to implement a model development strategy to determine a user's tendency to respond to an ad.
Which technique should you use?
- A. Use a Relative Expression Split module to partition the data based on centroid distance.
- B. Use a Relative Expression Split module to partition the data based on distance travelled to the event.
- C. Use a Split Rows module to partition the data based on distance travelled to the event.
- D. Use a Split Rows module to partition the data based on centroid distance.
Answer:
A
Explanation:
Split Data partitions the rows of a dataset into two distinct sets.
The Relative Expression Split option in the Split Data module of Azure Machine Learning Studio is helpful when you need to
divide a dataset into training and testing datasets using a numerical expression.
Relative Expression Split: Use this option whenever you want to apply a condition to a number column. The number could be
a date/time field, a column containing age or dollar amounts, or even a percentage. For example, you might want to divide
your data set depending on the cost of the items, group people by age ranges, or separate data by a calendar date.
Scenario:
Local market segmentation models will be applied before determining a user's propensity to respond to an advertisement.
The distribution of features across training and production data are not consistent
Reference: https://docs.microsoft.com/en-us/azure/machine-learning/studio-module-reference/split-data
Question 8 Topic 1, Case Study 1Case Study Question View Case
You need to implement a new cost factor scenario for the ad response models as illustrated in the performance curve
exhibit.
Which technique should you use?
- A. Set the threshold to 0.5 and retrain if weighted Kappa deviates +/- 5% from 0.45.
- B. Set the threshold to 0.05 and retrain if weighted Kappa deviates +/- 5% from 0.5.
- C. Set the threshold to 0.2 and retrain if weighted Kappa deviates +/- 5% from 0.6.
- D. Set the threshold to 0.75 and retrain if weighted Kappa deviates +/- 5% from 0.15.
Answer:
A
Explanation:
Scenario:
Performance curves of current and proposed cost factor scenarios are shown in the following diagram: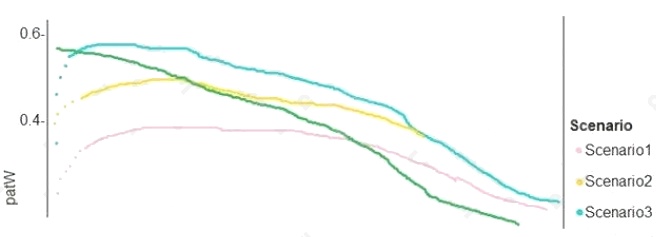
The ad propensity model uses a cut threshold is 0.45 and retrains occur if weighted Kappa deviated from 0.1 +/- 5%.
Question 9 Topic 2, Case Study 2Case Study Question View Case
HOTSPOT
You need to replace the missing data in the AccessibilityToHighway columns.
How should you configure the Clean Missing Data module? To answer, select the appropriate options in the answer area.
NOTE: Each correct selection is worth one point.
Hot Area: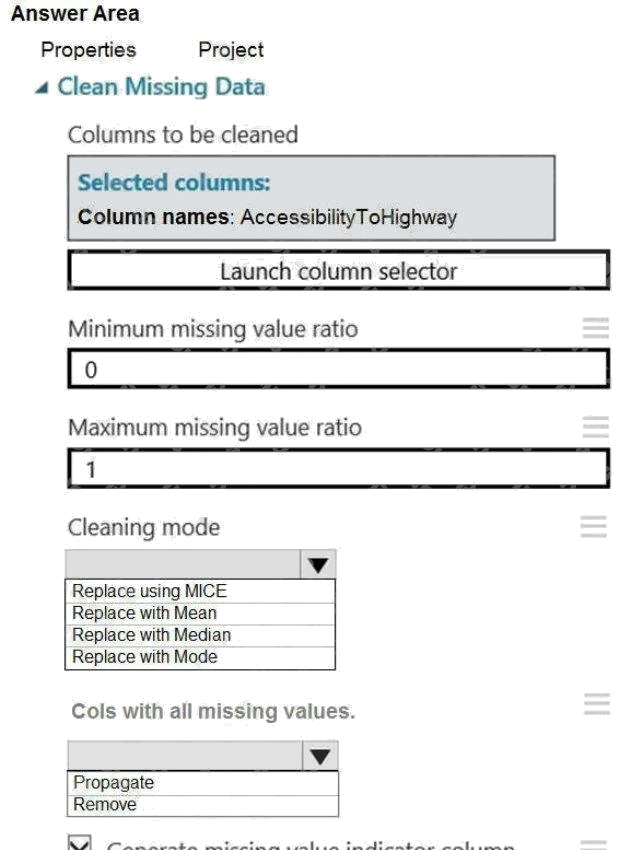

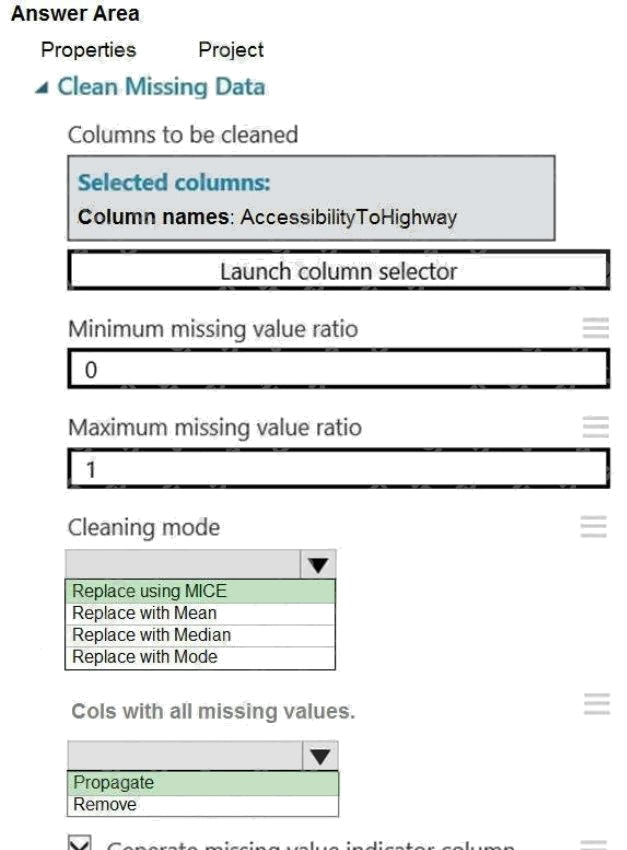
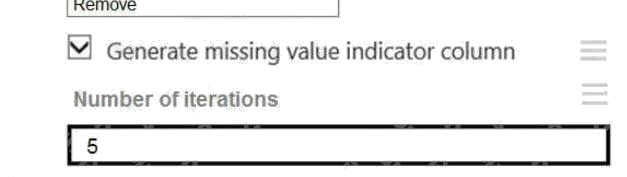
Answer:
Explanation:
Box 1: Replace using MICE
Replace using MICE: For each missing value, this option assigns a new value, which is calculated by using a method
described in the statistical literature as "Multivariate Imputation using Chained Equations" or "Multiple Imputation by Chained
Equations". With a multiple imputation method, each variable with missing data is modeled conditionally using the other
variables in the data before filling in the missing values.
Scenario: The AccessibilityToHighway column in both datasets contains missing values. The missing data must be replaced
with new data so that it is modeled conditionally using the other variables in the data before filling in the missing values.
Box 2: Propagate
Cols with all missing values indicate if columns of all missing values should be preserved in the output.
Reference: https://docs.microsoft.com/en-us/azure/machine-learning/studio-module-reference/clean-missing-data
Question 10 Topic 2, Case Study 2Case Study Question View Case
DRAG DROP
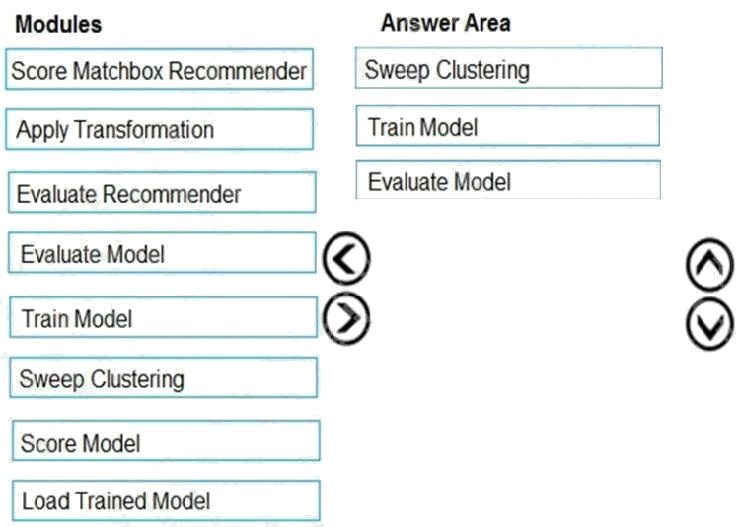
You need to produce a visualization for the diagnostic test evaluation according to the data visualization requirements.
Which three modules should you recommend be used in sequence? To answer, move the appropriate modules from the list
of modules to the answer area and arrange them in the correct order.
Select and Place: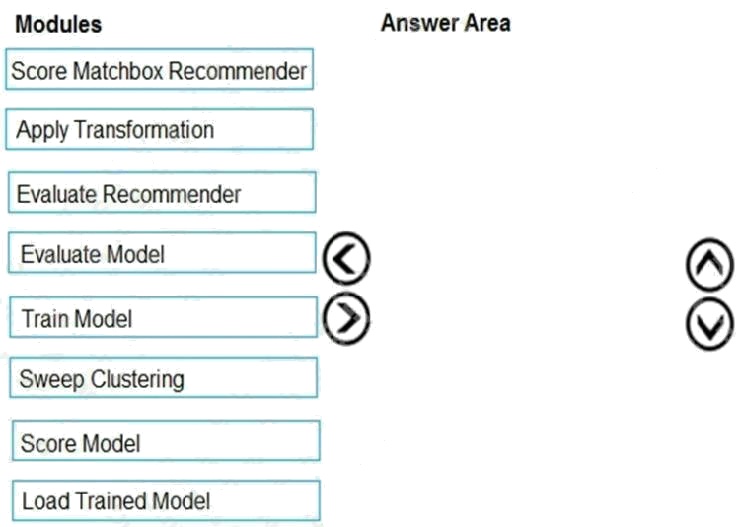
Answer:
Explanation:
Step 1: Sweep Clustering
Start by using the "Tune Model Hyperparameters" module to select the best sets of parameters for each of the models we're
considering.
One of the interesting things about the "Tune Model Hyperparameters" module is that it not only outputs the results from the
Tuning, it also outputs the Trained Model.
Step 2: Train Model
Step 3: Evaluate Model
Scenario: You need to provide the test results to the Fabrikam Residences team. You create data visualizations to aid in
presenting the results.
You must produce a Receiver Operating Characteristic (ROC) curve to conduct a diagnostic test evaluation of the model.
You need to select appropriate methods for producing the ROC curve in Azure Machine Learning Studio to compare the
Two-Class Decision Forest and the Two-Class Decision Jungle modules with one another.
References: http://breaking-bi.blogspot.com/2017/01/azure-machine-learning-model-evaluation.html
Question 11 Topic 2, Case Study 2Case Study Question View Case
You need to visually identify whether outliers exist in the Age column and quantify the outliers before the outliers are
removed.
Which three Azure Machine Learning Studio modules should you use? Each correct answer presents part of the solution.
NOTE: Each correct selection is worth one point.
- A. Create Scatterplot
- B. Summarize Data
- C. Clip Values
- D. Replace Discrete Values
- E. Build Counting Transform
Answer:
A B C
Explanation:
B: To have a global view, the summarize data module can be used. Add the module and connect it to the data set that needs
to be visualized. A: One way to quickly identify Outliers visually is to create scatter plots.
C: The easiest way to treat the outliers in Azure ML is to use the Clip Values module. It can identify and optionally replace
data values that are above or below a specified threshold.
You can use the Clip Values module in Azure Machine Learning Studio, to identify and optionally replace data values that
are above or below a specified threshold. This is useful when you want to remove outliers or replace them with a mean, a
constant, or other substitute value.
Reference:
https://blogs.msdn.microsoft.com/azuredev/2017/05/27/data-cleansing-tools-in-azure-machine-learning/
https://docs.microsoft.com/en-us/azure/machine-learning/studio-module-reference/clip-values
Question 12 Topic 2, Case Study 2Case Study Question View Case
HOTSPOT
You need to identify the methods for dividing the data according to the testing requirements.
Which properties should you select? To answer, select the appropriate options in the answer area.
NOTE: Each correct selection is worth one point.
Hot Area: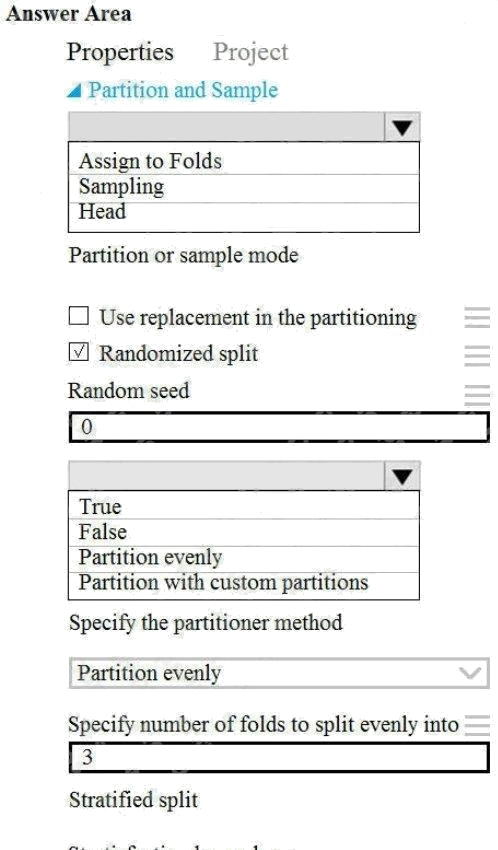
Answer:

Explanation:
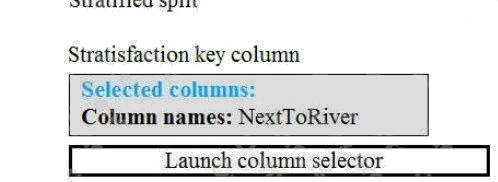
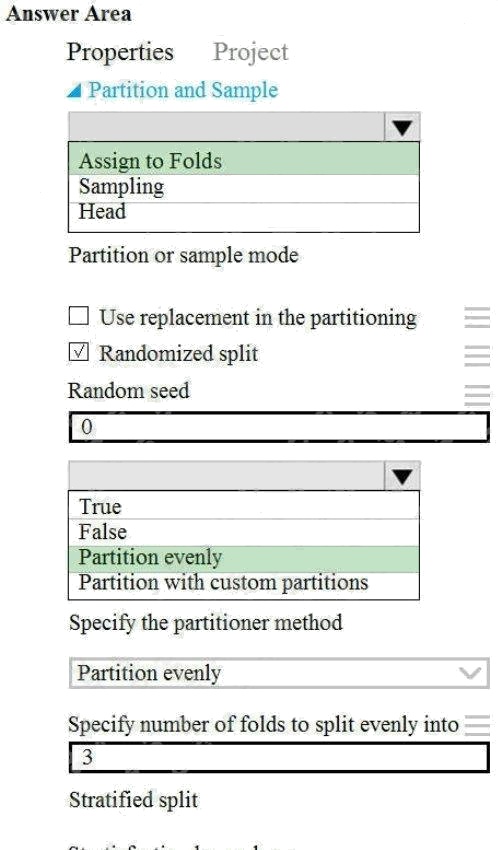
Scenario: Testing
You must produce multiple partitions of a dataset based on sampling using the Partition and Sample module in Azure
Machine Learning Studio.
Box 1: Assign to folds
Use Assign to folds option when you want to divide the dataset into subsets of the data. This option is also useful when you
want to create a custom number of folds for cross-validation, or to split rows into several groups.
Not Head: Use Head mode to get only the first n rows. This option is useful if you want to test a pipeline on a small number
of rows, and don't need the data to be balanced or sampled in any way.
Not Sampling: The Sampling option supports simple random sampling or stratified random sampling. This is useful if you
want to create a smaller representative sample dataset for testing.
Box 2: Partition evenly
Specify the partitioner method: Indicate how you want data to be apportioned to each partition, using these options:
Partition evenly: Use this option to place an equal number of rows in each partition. To specify the number of output
partitions, type a whole number in the Specify number of folds to split evenly into text box.
Reference: https://docs.microsoft.com/en-us/azure/machine-learning/algorithm-module-reference/partition-and-sample
Question 13 Topic 2, Case Study 2Case Study Question View Case
HOTSPOT
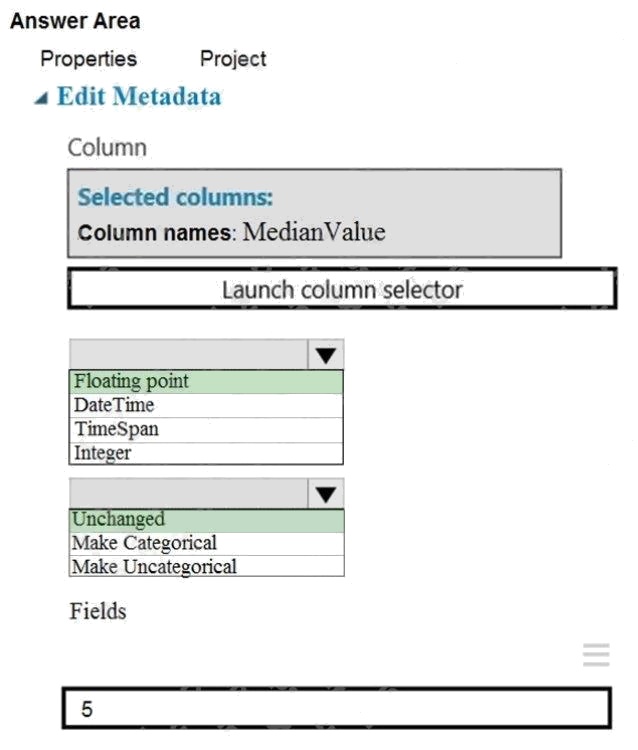
You need to configure the Edit Metadata module so that the structure of the datasets match.
Which configuration options should you select? To answer, select the appropriate options in the answer area.
NOTE: Each correct selection is worth one point.
Hot Area: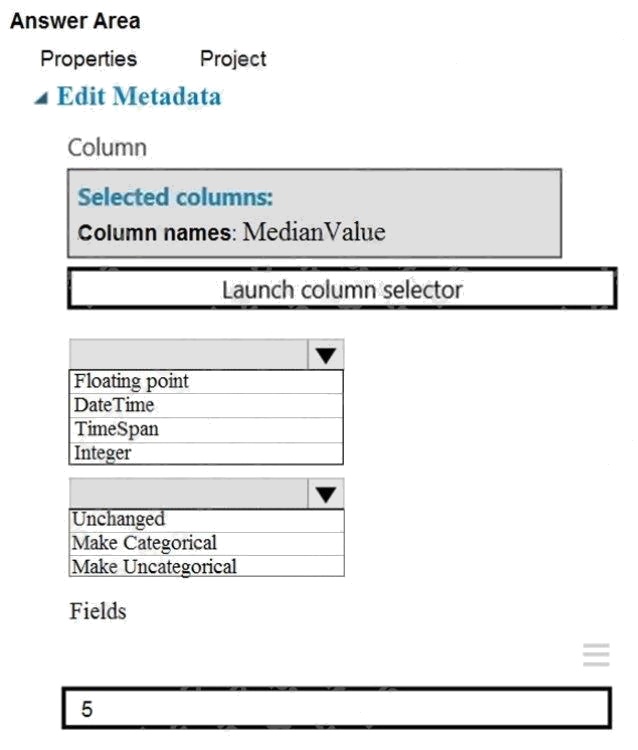
Answer:
Explanation:
Box 1: Floating point
Need floating point for Median values.
Scenario: An initial investigation shows that the datasets are identical in structure apart from the MedianValue column. The
smaller Paris dataset contains the MedianValue in text format, whereas the larger London dataset contains the MedianValue
in numerical format.
Box 2: Unchanged
Note: Select the Categorical option to specify that the values in the selected columns should be treated as categories.
For example, you might have a column that contains the numbers 0,1 and 2, but know that the numbers actually mean
"Smoker", "Non smoker" and "Unknown". In that case, by flagging the column as categorical you can ensure that the values
are not used in numeric calculations, only to group data.
Prepare data for modeling
Question 14 Topic 2, Case Study 2Case Study Question View Case
HOTSPOT
You need to configure the Permutation Feature Importance module for the model training requirements.
What should you do? To answer, select the appropriate options in the dialog box in the answer area.
NOTE: Each correct selection is worth one point.
Hot Area: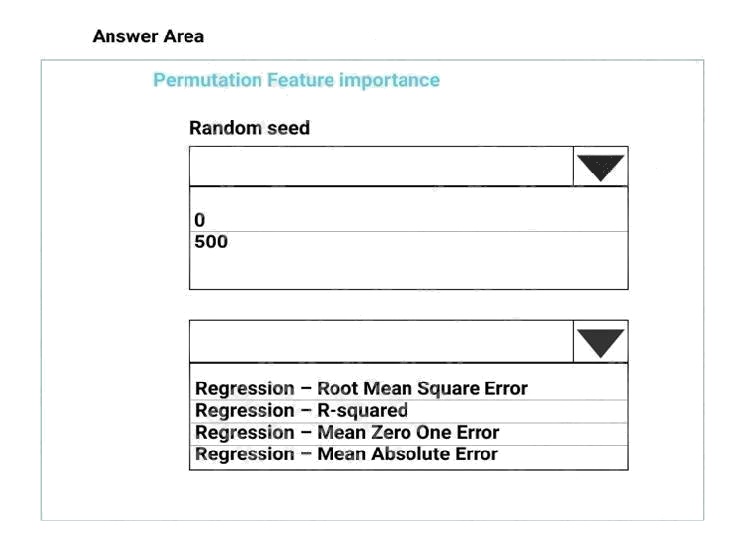
Answer:
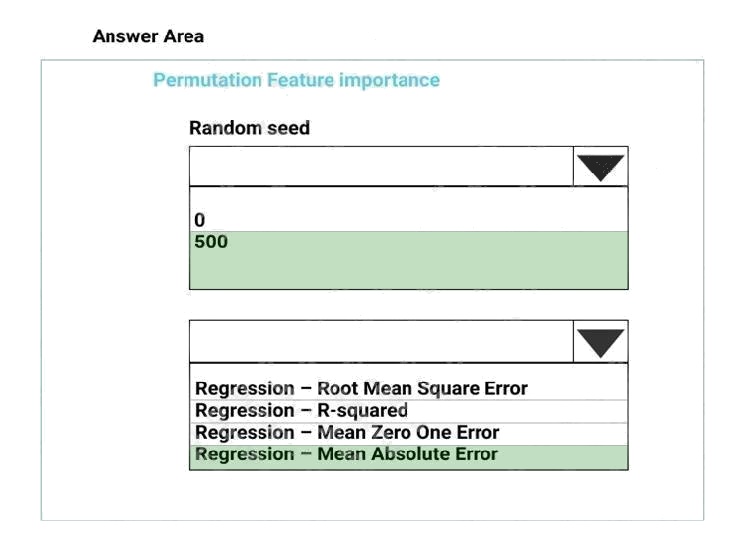
Explanation:
Box 1: 500
For Random seed, type a value to use as seed for randomization. If you specify 0 (the default), a number is generated based
on the system clock.
A seed value is optional, but you should provide a value if you want reproducibility across runs of the same experiment. Here
we must replicate the findings.
Box 2: Mean Absolute Error
Scenario: Given a trained model and a test dataset, you must compute the Permutation Feature Importance scores of
feature variables. You need to set up the Permutation Feature Importance module to select the correct metric to investigate
the models accuracy and replicate the findings.
Regression. Choose one of the following: Precision, Recall, Mean Absolute Error , Root Mean Squared Error, Relative
Absolute Error, Relative Squared Error, Coefficient of Determination
References: https://docs.microsoft.com/en-us/azure/machine-learning/studio-module-reference/permutation-feature-
importance
Question 15 Topic 2, Case Study 2Case Study Question View Case
You need to select a feature extraction method.
Which method should you use?
- A. Mutual information
- B. Pearson's correlation
- C. Spearman correlation
- D. Fisher Linear Discriminant Analysis
Answer:
C
Explanation:
Spearman's rank correlation coefficient assesses how well the relationship between two variables can be described using a
monotonic function.
Note: Both Spearman's and Kendall's can be formulated as special cases of a more general correlation coefficient, and they
are both appropriate in this scenario.
Scenario: The MedianValue and AvgRoomsInHouse columns both hold data in numeric format. You need to select a feature
selection algorithm to analyze the relationship between the two columns in more detail.
Incorrect Answers:
B: The Spearman correlation between two variables is equal to the Pearson correlation between the rank values of those two
variables; while Pearson's correlation assesses linear relationships, Spearman's correlation assesses monotonic
relationships (whether linear or not).
Reference: https://docs.microsoft.com/en-us/azure/machine-learning/studio-module-reference/feature-selection-modules