google LOOKER BUSINESS ANALYST Exam Questions
Questions for the LOOKER BUSINESS ANALYST were updated on : Jun 26 ,2025
Page 1 out of 3. Viewing questions 1-15 out of 40
Question 1
An analyst creates a dashboard that shows sales at an aggregate and then an individual level. This dashboard is slow to
run, and the analyst sees a warning about how load times may be impacted in dashboards with more than 25 tiles.
What should the analyst create to make sure all data sources in this dashboard are connected but still load quickly?
- A. Dashboard filter to specify which individual data shows
- B. Two dashboards, one with aggregate and one with individual data
- C. Two dashboards with a text tile to hyperlink from one dashboard to the other
- D. Folder with all dashboard tiles for aggregate data and individual data.
Answer:
A
Question 2
The analyst is exploring weekly sales revenue in the last 3 months using a line chart. One requirement is to show the sales
target $30,000 in the chart.
Which solution can help the analyst display the sales target?
- A. Add a trend line for 30000.
- B. Add a Tick Density of 30000.
- C. Add a reference line for 30000.
- D. Add a table calculation to hide values less than 30000.
Answer:
A
Explanation:
Reference: https://docs.looker.com/exploring-data/visualizing-query-results/line-options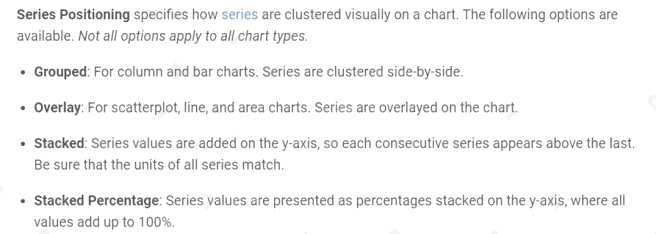
Question 3
Two users report seeing different results on the same dashboard.
Which three configurations could explain these discrepancies? (Choose three.)
- A. The time zone setting is different for each user.
- B. Looker caching is affecting results.
- C. The dashboard uses separate Explores for each user.
- D. Dashboard filters are being used
- E. The dashboard was accessed via different boards.
Answer:
C D E
Question 4
The sales team has all its Looker content stored in a folder called Sales. Team members are complaining that the Looks and
dashboards have been getting moved and edited in unwanted ways. Only the sales analyst should be editing the content in
the Sales folder.
Which access settings should be applied to the folder?
- A. Admins: Manage Access, Edit Sales analyst: Edit Sales group: View
- B. Admins: View Sales analyst: Edit Sales group: View
- C. Admins: View Sales analyst: Manage Access, Edit Sales group: View
- D. Admins: Manage Access, Edit Sales analyst: Manage Access, Edit Sales group: View
Answer:
A
Question 5
An analyst at a banana quality assurance firm needs to compare performance week over week to make sure the firm stays
on track. The analyst needs to show two metrics:
1. Number of bananas cleared for consumption the previous week
2. Number of bananas cleared for consumption the week before that
Which process should the analyst follow to show these two metrics in a report?
- A. Create two tiles on a dashboard and two dashboard filters. Apply a different filter to each tile (“last week” and “2 weeks ago” respectively)
- B. Create one tile on a dashboard and two dashboard filters (last week and 2 weeks ago respectively). Apply both dashboard filters to the tile.
- C. Create two tiles on a dashboard. In the Edit mode of one tile, add a filter for “last week”. Add a dashboard filter for “2weeks ago” and apply it to the other tile.
- D. Create two identical looks in the same folder. Add filters on them for “last week” and “2 weeks ago” respectively.
Answer:
C
Question 6
An analyst has an Explore query that shows the sum of spend over time. The Explore query has the Sum of Spend measure
pivoted by a Category of Spend dimension. The Category of Spend dimension has a value for Budgeted Spend and then
categories for each type of unbudgeted spend.
Which visualization feature should the analyst use to separate budgeted spend visually from each category of unbudgeted
spend?
- A. Display row totals for each category.
- B. Series type customization on budgeted spend.
- C. Grouped series positioning on budgeted spend.
- D. Transpose table to separate out budgeted spend.
Answer:
D
Question 7
A CEO wants to receive a daily email with the existing executive dashboard to review on a mobile device on the way to the
office.
What should the analyst do to optimize the dashboard for mobile viewing?
- A. Schedule the dashboard as HTML to adjust automatically.
- B. Schedule the dashboard with the PDF format Use single column layout.
- C. Create a mobile-friendly version of the dashboard by rearranging the tiles, and schedule the dashboard.
- D. Schedule the dashboard with PDF paper size set to Fit Page to Dashboard.
Answer:
B
Question 8
An analyst has created a dashboard that needs to be integrated into the companys internal support portal. The dashboard
should match the style of the support portal.
How should the analyst display the dashboard in the style of the support portal without changing the style of the tiles in
Looker?
- A. Copy the dashboard.
- B. Edit embed settings.
- C. Apply a table theme.
- D. Edit HTML on the dashboard.
Answer:
B
Explanation:
Reference: https://looker.com/platform/blocks/embedded/embed-a-dashboard
Question 9
An analyst needs to send a daily PDF to three different stores and wants it to contain five visualizations of KPI data. Each
stores users must receive only the data filtered for that store. The analyst needs to see all store data in Looker.
What should the analyst build to accommodate these requirements?
- A. Three dashboards, one for each store
- B. Three schedules filtered by store
- C. Five schedules, one for each visualization
- D. A dashboard with three filters, one for each store
Answer:
D
Question 10
An analyst is trying to create a pie chart showing the breakdown of the top sales by brand in an Explore. The analyst selects
the Brand Name dimension and a measure for the Count of Items Sold. The analyst then selects the pie chart visualization,
but sees the error Too Many Rows: Pie charts can display a maximum of 50 rows of data.
How can the analyst resolve this error and create a pie chart that will always show the top brands by items sold?
- A. Sort the data by Count of Items Sold descending and apply a row limit of 50.
- B. Sort the data by Brand Name alphabetically and apply a row limit of 50.
- C. Apply a filter on the Count of Items Sold measure that requires the count to be greater than zero.
- D. Apply a filter on the Count of Items Sold measure that requires the count to be not NULL, sort the data by Count of Items Sold ascending, and apply a row limit of 50.
Answer:
C
Explanation:
Reference: https://community.looker.com/dashboards-looks-7/top-5-and-other-10743
Question 11
A global dashboard filter and the filter on a tile within that dashboard conflict because the global dashboard filter and the
individual tile filter are based on the same field with different filter values.
What happens in this situation?
- A. The filter values of both filters will combine in an additive manner and both filters will apply.
- B. The individual tile’s filter will override the global dashboard filter.
- C. The global dashboard filter will override the individual tile filter.
- D. The dashboard will break and warn the user that there are conflicting filter values.
Answer:
C
Question 12
An analyst has a dashboard with table visualizations that display the first few results, and the user can scroll down to see the
remaining results. The analyst wants to download a PDF of the dashboard.
How should the analyst ensure that the PDF shows all available results in the UI dashboard?
- A. Select the Expand Tables option.
- B. Select the All Results option
- C. Select the Allow Scroll option and specify each table.
- D. Select the Paper Size option and specify a large size.
Answer:
A
Explanation:
Reference: https://docs.looker.com/sharing-and-publishing/downloading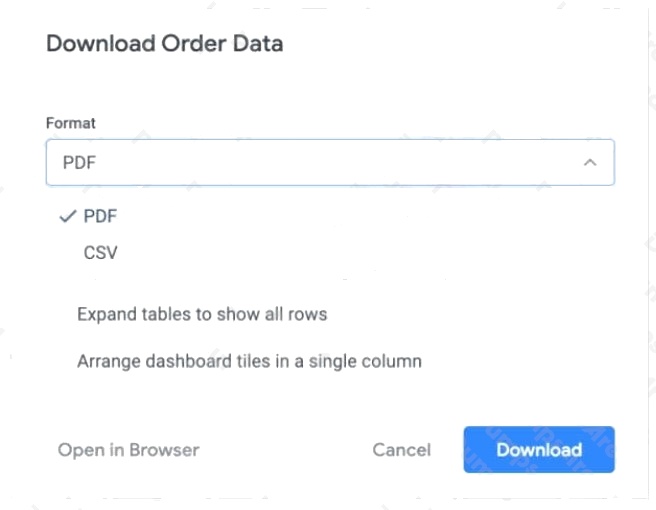
Question 13
An analyst needs to send a Look to an external client in CSV format. When the data is being downloaded, the Limit section
has the option to select All Results grayed out, with text reading All Results
Unavailable.
What are three causes of this message? (Choose three.)
- A. The Row Limit chosen in the Look is too high.
- B. There is a table calculation in the Look.
- C. Unlimited results are unsupported by CSV format.
- D. The Row Totals option is turned on in the Look.
- E. There is a Running Total measure in the Look.
- F. The Totals option is turned on in the Look.
Answer:
A B D
Explanation:
Reference: https://docs.looker.com/sharing-and-publishing/downloading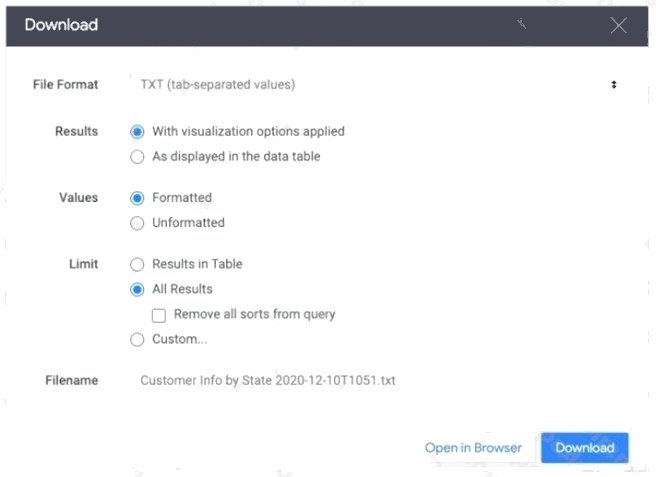
Question 14
An analyst works on the data team at an organization that maintains multiple similar Explores. The analyst has access to see
every Explore, but knows that employees in the finance department only have access to explores tagged Finance.
There is an Employee Compensation Data Finance Explore that the finance department has access to. The analyst usually
uses an All Employee Data Explore that also includes personally identifiable information.
What should the analyst do to ensure proper access if the analyst wants to send an example visualization to the finance
team?
- A. Create Merged Results with the Employee Compensation Data Finance Explore and the All Employee Data Explore, and send the URL of the Merged Results.
- B. Use the Employee Compensation Data Finance Explore and send the URL of the Explore to the finance team.
- C. Use the All Employee Data Explore, but use Looker’s built-in Send functionality to email the visualization.
- D. Use the All Employee Data Explore, add a filter to exclude personally identifiable information, and send the URL of the Explore to the finance team.
Answer:
B
Question 15
An analyst is creating a map that colors cities by their population. After adding fields and selecting the Interactive Map
visualization, the analyst receives this error message:
At least one dimension should be of type Location or have a map_layer specified.
There are currently three fields in the Explore:
City Name (Dimension)
Population (Measure)
Number of Museums (Measure)
What should the analyst do to resolve this error?
- A. Remove the Number of Museums measure from the Explore
- B. Select the Static Map visualization instead of Interactive
- C. Contact the LookML Developer
- D. Add a table calculation that evaluates location (${cities.city_name})
Answer:
D