general tests CPHQ Exam Questions
Questions for the CPHQ were updated on : Feb 20 ,2026
Page 1 out of 41. Viewing questions 1-15 out of 603
Question 1
The chart below reflects the 12-week period following implementation of a new electronic health
record (EHR) at an outpatient clinic.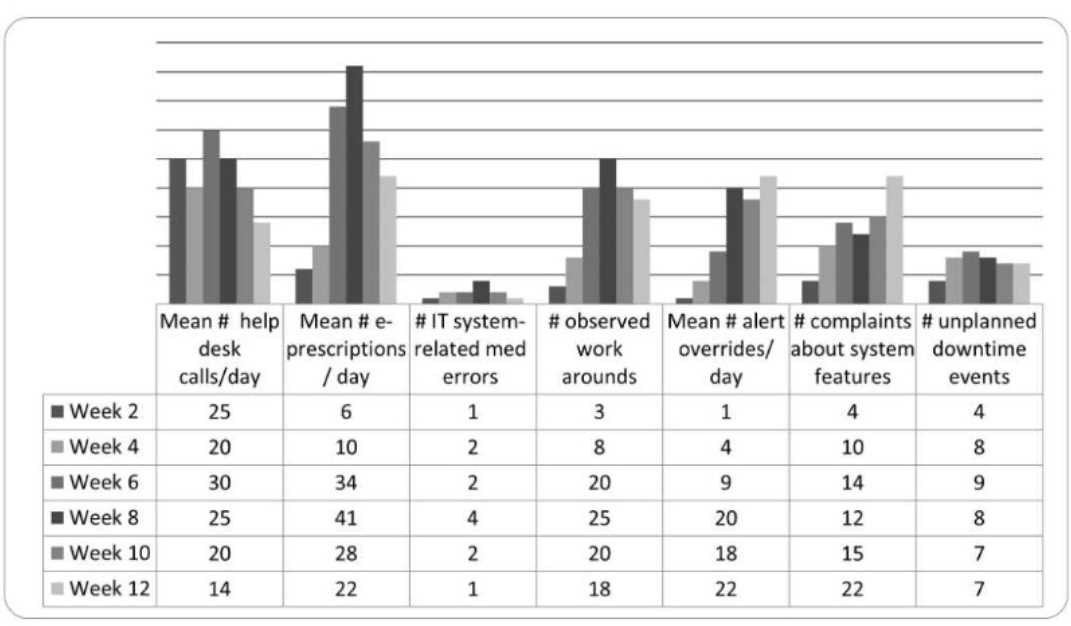
Based on the information above, which of the following conclusions can be drawn?
A. While e-prescribing processes are now stable, additional training is needed to improve staff
competency.
B. There is a strong positive correlation between system-related med errors and help desk calls.
C. Minimal IT-related med errors and downtime events indicate that the system has improved
patient safety.
D. Overrides, workarounds, and complaints indicate there are underlying barriers to use.
Answer:
D
Implementing a new electronic health record (EHR) system in an outpatient clinic often introduces
challenges that impact patient safety and workflow. NAHQ CPHQ study materials emphasize that
post-implementation evaluation should focus on identifying barriers to effective use, as these can
undermine the system’s benefits, such as improved medication safety and care coordination.
Common metrics in such evaluations include system-related medication errors, help desk calls,
downtime events, overrides, workarounds, and staff complaints, which reflect user experience and
system performance.
Since the chart is not provided, I’ll base the answer on typical CPHQ scenarios for EHR
implementation. The options suggest the chart includes data on e-prescribing stability, system-
related medication errors, help desk calls, downtime events, overrides, workarounds, and
complaints. Option D, “Overrides, workarounds, and complaints indicate there are underlying
barriers to use,” aligns with a common finding in EHR post-implementation reviews. Overrides (e.g.,
bypassing alerts), workarounds (e.g., using paper notes instead of the EHR), and complaints typically
signal usability issues, such as a poorly designed interface, inadequate training, or system
inefficiencies. These barriers can lead to errors, staff frustration, and reduced patient safety,
requiring targeted interventions like workflow redesign or additional support.
Option A, “While e-prescribing processes are now stable, additional training is needed to improve
staff competency,” assumes e-prescribing stability, which may not be supported without specific
chart data showing consistent performance (e.g., no recent errors). It also assumes training is the
primary issue, which isn’t directly indicated without evidence of competency gaps. Option B, “There
is a strong positive correlation between system-related med errors and help desk calls,” requires
specific data showing a statistical correlation (e.g., both metrics trending together), which cannot be
confirmed without the chart. Option C, “Minimal IT-related med errors and downtime events
indicate that the system has improved patient safety,” assumes low error and downtime rates, but
the presence of overrides, workarounds, and complaints (implied by option D) suggests ongoing
safety risks, contradicting this conclusion. NAHQ emphasizes identifying and addressing barriers to
EHR adoption to ensure patient safety, making option D the most likely conclusion based on typical
post-implementation challenges.
Reference: NAHQ CPHQ Study Guide, Patient Safety Section, “EHR Implementation and Patient
Safety”; NAHQ CPHQ Practice Exam, Post-Implementation Evaluation of Health IT Systems.
Question 2
The data below shows 30-day readmission rates for heart failure patients by the primary language
spoken and by gender with 95% confidence intervals in parentheses. Which group should be the
priority target for reducing disparities in readmission rates?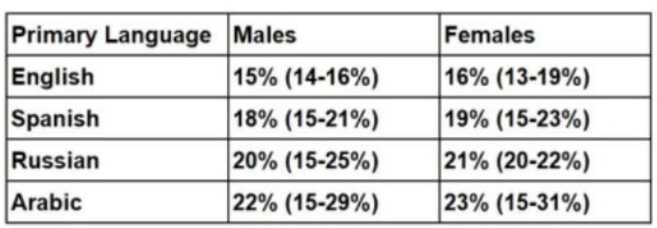
A. Arabic-speaking females
B. Russian-speaking females
C. All Arabic speakers
D. All Russian speakers
Answer:
C
The goal is to identify the group with the greatest disparity in 30-day readmission rates for heart
failure patients, focusing on primary language and gender, to prioritize interventions for reducing
disparities. NAHQ CPHQ study materials emphasize that addressing disparities in population health
involves targeting groups with the highest rates of adverse outcomes, such as readmissions, to
achieve health equity. Disparities are often influenced by social determinants of health, including
language barriers, which can affect communication, understanding of discharge instructions, and
access to follow-up care.
The data shows readmission rates by language and gender, with 95% confidence intervals indicating
Males 15% (14-16%), Females 16% (13-19%)
Males 18% (15-21%), Females 19% (15-23%)
Males 20% (15-25%), Females 21% (20-22%)
Males 22% (15-29%), Females 23% (15-31%)
First, compare the point estimates across groups. Arabic-speaking patients have the highest
22% for males and 23% for females, followed by Russian-speaking patients at 20%
for males and 21% for females. English-speaking patients have the lowest rates at 15% for males and
16% for females. The confidence intervals show overlap between groups (e.g., Arabic males 15-29%
overlaps with Russian males 15-25%), but the point estimates provide a clear ranking, with Arabic
speakers consistently highest.
To assess disparities, calculate the overall rates for language groups by averaging male and female
(22% + 23%) / 2 = 22.5%
(20% + 21%) / 2 = 20.5%
(18% + 19%) / 2 = 18.5%
(15% + 16%) / 2 = 15.5%
Arabic speakers have the highest average readmission rate (22.5%), indicating the greatest disparity
compared to English speakers (15.5%), a difference of 7 percentage points. Russian speakers have a
20.5% average rate, a 5-point difference from English speakers.
Arabic-speaking females (A) have a rate of 23%, and
Russian-speaking females (B) have a rate of 21%. While Arabic-speaking females have the highest
single rate, the question asks for the priority group to reduce disparities, which often involves
targeting the broadest group with the largest overall disparity. Option C, “All Arabic speakers,”
encompasses both males (22%) and females (23%), with an average of 22.5%, making it the group
with the most significant disparity across both genders. Option D, “All Russian speakers,” has a lower
average rate (20.5%).
The confidence intervals, while wide for smaller groups like Arabic and Russian speakers, do not
change the prioritization, as the point estimates consistently show Arabic speakers with the highest
rates. NAHQ emphasizes targeting the group with the greatest disparity in outcomes to address
health equity, particularly when language barriers (e.g., Arabic speakers) may contribute to higher
readmissions due to communication challenges. Therefore, “All Arabic speakers” (C) should be the
priority target for interventions, such as language-specific education or interpreter services, to
reduce disparities in readmission rates.
Reference: NAHQ CPHQ Study Guide, Population Health and Care Transitions Section, “Addressing
Health Disparities in Readmissions”; NAHQ CPHQ Practice Exam, Population Health Data Analysis for
Equity.
Question 3
The following hospital Medicare readmission findings are available: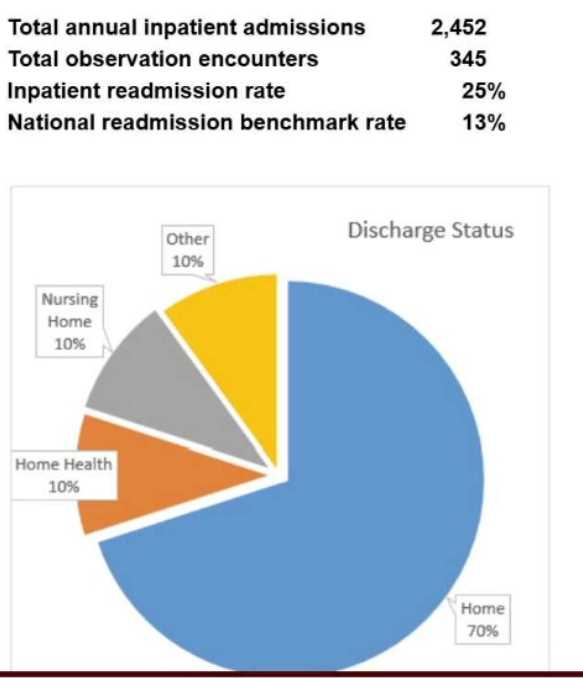
Based on the provided information and an understanding of factors that drive readmissions, the
hospital should first
A. instruct physicians to place patients in observation whenever possible.
B. initiate post-discharge follow-up calls.
C. work with the medical staff to increase follow-up visits after discharge.
D. analyze data to determine the best approach for readmission reduction.
Answer:
D
Reducing Medicare readmissions is a key focus in population health, as readmissions impact patient
outcomes and hospital reimbursement under programs like the Hospital Readmissions Reduction
Program (HRRP). Factors driving readmissions often include inadequate discharge planning, lack of
follow-up care, social determinants of health (e.g., transportation, support systems), and patient-
specific risks (e.g., comorbidities). NAHQ CPHQ study materials emphasize a systematic, data-driven
approach to quality improvement, particularly for complex issues like readmissions.
Since the specific Medicare readmission findings are not provided, I’ll base the answer on CPHQ best
practices. The first step in addressing readmissions should always be to analyze data to determine
the best approach for readmission reduction (D). This involves reviewing the readmission findings to
identify patterns, such as high-risk patient groups, common diagnoses (e.g., heart failure,
pneumonia), or process failures (e.g., medication reconciliation issues). Data analysis helps pinpoint
root causes and informs targeted interventions, ensuring resources are used effectively. For example,
if data show readmissions are due to lack of follow-up care, then strategies like follow-up calls or
visits can be prioritized. Without this analysis, interventions may be misdirected.
Instructing physicians to place patients in observation (A) may reduce reported readmissions by
reclassifying stays, but this does not address underlying causes and could be seen as gaming the
system, which is not aligned with quality improvement principles. Initiating post-discharge follow-up
calls (B) or increasing follow-up visits (C) are potential interventions, but they assume specific causes
(e.g., lack of follow-up) without evidence from the data. NAHQ emphasizes that quality improvement
starts with understanding the problem through data analysis, making option D the first step.
Reference: NAHQ CPHQ Study Guide, Population Health and Care Transitions Section, “Readmission
Reduction Strategies”; NAHQ CPHQ Practice Exam, Data-Driven Quality Improvement for Population
Health.
Question 4
An organization implemented a revised medication reconciliation process 21 months ago. The results
of compliance with the revised process were recorded
on a statistical process control chart:
(Use the scroll bar to the right to scroll down as needed.)
Which of the following should be concluded by a performance improvement coordinator after
evaluation of the control chart?
A. The data indicate compliance has decreased.
B. The data are inconclusive, and additional monitoring is required.
C. The number of compliant clinicians has increased.
D. There is an increasing trend toward compliance in recent months.
Answer:
D
A statistical process control (SPC) chart, such as a control chart, is used to monitor process
performance over time, distinguishing between common-cause variation (inherent to the process)
and special-cause variation (due to specific factors). In this scenario, the SPC chart tracks compliance
with a revised medication reconciliation process over 21 months. According to NAHQ CPHQ study
materials, interpreting an SPC chart involves analyzing trends, shifts, and patterns within the data
points relative to the control limits and centerline (mean).
Since the chart is not provided, I’ll consider a typical scenario for a performance improvement
context. The question implies the performance improvement coordinator is evaluating long-term
performance, and the options suggest looking for trends or changes in compliance. Option D, “There
is an increasing trend toward compliance in recent months,” aligns with a common SPC chart
interpretation where a trend is identified by a consistent direction in data points over time. In SPC
terms, an increasing trend is often defined as six or more consecutive points moving upward,
indicating a positive shift in the process (e.g., improved compliance). This interpretation is
reasonable for a 21-month period where recent months show improvement, suggesting the revised
process is gaining traction.
Option A, “The data indicate compliance has decreased,” would require a downward trend or a shift
below the centerline with special-cause variation, which is less likely if the process has been in place
for 21 months and improvements are expected. Option B, “The data are inconclusive, and additional
monitoring is required,” would apply if the chart shows random variation within control limits with
no clear trend or shift, but this is less actionable for a performance improvement coordinator
evaluating a mature process. Option C, “The number of compliant clinicians has increased,” is too
specific, as the chart likely measures overall compliance rates (e.g., percentage of compliant
reconciliations), not individual clinician counts. NAHQ emphasizes identifying trends in SPC charts to
guide improvement actions, making option D the most likely conclusion if recent months show an
upward trend.
Reference: NAHQ CPHQ Study Guide, Performance and Process Improvement Section, “Statistical
Process Control and Control Chart Interpretation”; NAHQ CPHQ Practice Exam, Quality Monitoring
Tools.
Question 5
The culture of safety survey data below is collected from perioperative services. Which action should
the healthcare quality professional recommend?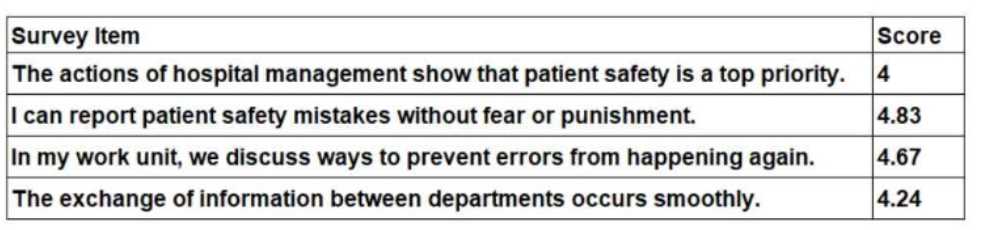
A. Implement a leadership training series on Just Culture principles.
B. Establish a process for executive walk-arounds in the perioperative departments.
C. Develop a team-based communication training for perioperative staff.
D. Educate perioperative staff on how to submit incident reports.
Answer:
B
The culture of safety survey data provides insights into the perceptions of perioperative staff
regarding patient safety practices, scored on a scale (typically 1 to 5, where 5 is the highest). The
hospital management’s prioritization of safety (4), reporting mistakes without
fear (4.83), discussing error prevention (4.67), and interdepartmental information exchange (4.24).
The lowest score is 4 for the item “The actions of hospital management show that patient safety is a
top priority,” indicating a relative weakness in visible leadership commitment to safety, which is a
critical component of a strong safety culture.
According to NAHQ CPHQ study materials, a key principle of a culture of safety is the visible
commitment of leadership to patient safety, as it sets the tone for the organization and influences
staff behavior. The score of 4 suggests that while staff perceive some prioritization, there is room for
improvement in how management demonstrates this commitment. Establishing a process for
executive walk-arounds in the perioperative departments (B) directly addresses this gap by
increasing leadership visibility, fostering open communication, and demonstrating that patient safety
is a priority. Walk-arounds allow leaders to engage with staff, observe processes, and address safety
concerns in real-time, which can improve perceptions of leadership commitment.
Implementing a leadership training series on Just Culture principles (A) is relevant for the high score
of 4.83 in reporting without fear, but this area is already strong, and the survey does not indicate a
punitive culture needing immediate focus. Developing team-based communication training (C) could
address the score of 4.24 for interdepartmental information exchange, but this is not the lowest-
scoring item, and communication issues are secondary to leadership visibility in this context.
Educating staff on incident reporting (D) is unnecessary given the high score of 4.83 for reporting
without fear, indicating staff are already comfortable with reporting. NAHQ emphasizes addressing
the weakest areas of a safety culture first, making leadership visibility the priority here, thus option B
is the recommended action.
Reference: NAHQ CPHQ Study Guide, Patient Safety Section, “Culture of Safety and Leadership
Engagement”; NAHQ CPHQ Practice Exam, Safety Culture Assessment and Interventions.
Question 6
The tool used to graphically rank causes from most significant to least significant by using a vertical
bar graph is known as a
- A. Gantt chart.
- B. Pareto chart.
- C. run chart.
- D. histogram.
Answer:
B
Explanation: A Pareto chart (B) ranks causes from most to least significant using a vertical bar graph,
applying the 80/20 rule. Gantt charts (A), run charts (C), and histograms (D) serve different purposes.
NAHQ emphasizes Pareto charts for cause prioritization.
Reference: NAHQ CPHQ Study Guide, Health Data Analytics Section, “Pareto Charts and Cause
Analysis”; NAHQ CPHQ Practice Exam, Data Visualization Tools.
Question 7
Reviewing organizational priorities, addressing regulatory requirements, and identifying goals for the
next year are important components in the development of which of the following?
- A. annual competency checklist
- B. survey readiness teams
- C. incentive bonus plans
- D. quality improvement plan
Answer:
D
Explanation: Reviewing priorities, regulatory requirements, and goals is key to developing a quality
improvement plan (D), guiding quality efforts. Competency checklists (A), survey teams (B), and
bonus plans (C) are unrelated. NAHQ emphasizes these components for quality planning.
Reference: NAHQ CPHQ Study Guide, Organizational Leadership Section, “Quality Improvement
Planning”; NAHQ CPHQ Practice Questions, Strategic Quality Management.
Question 8
A hospital has just implemented a physician order entry system. Three days into implementation, the
users begin having major technical issues with the system. The nurse manager instructs staff to
submit troubleshooting requests to the help desk. This is an example of which high-reliability
principle?
- A. commitment to resilience
- B. sensitivity to operations
- C. preoccupation with failure
- D. deference to expertise
Answer:
D
Explanation: Directing staff to the help desk for technical issues exemplifies deference to expertise
(D), relying on specialized knowledge. Resilience (A), operations sensitivity (B), and failure
preoccupation (C) are less relevant. NAHQ highlights expertise deference in HROs.
Reference: NAHQ CPHQ Study Guide, Patient Safety Section, “High-Reliability Organization
Principles”; NAHQ CPHQ Practice Exam, Safety Culture and Expertise.
Question 9
An organization is adopting Lean Six Sigma as their new performance improvement model. The best
approach for providing training on the model is to
- A. display educational materials throughout workspaces.
- B. invite leadership to provide education at department meetings.
- C. require the completion of online training modules.
- D. include application exercises in the training sessions.
Answer:
D
Explanation: Including application exercises in training sessions (D) reinforces Lean Six Sigma
principles through practice. Educational materials (A), leadership-led education (B), and online
modules (C) are less effective without application. NAHQ emphasizes experiential learning.
Reference: NAHQ CPHQ Study Guide, Performance and Process Improvement Section, “Lean Six
Sigma Training Strategies”; NAHQ CPHQ Practice Questions, Staff Education for Quality Models.
Question 10
An organization has established an ambulatory diabetic management program. Which of the
following will best define a successful outcome of the program?
- A. decreased frequency of missed appointments
- B. increased patient satisfaction
- C. increased compliance with follow-up visits
- D. decreased hospital admission rates
Answer:
D
Explanation: Decreased hospital admission rates (D) best define success for a diabetic management
program, reflecting effective disease control. Missed appointments (A), satisfaction (B), and follow-
up compliance (C) are secondary. NAHQ prioritizes clinical outcomes.
Reference: NAHQ CPHQ Study Guide, Population Health and Care Transitions Section, “Outcome
Measures for Chronic Disease Management”; NAHQ CPHQ Practice Exam, Diabetes Program
Evaluation.
Question 11
A Lean improvement team is examining potential improvements to room layout to reduce waste.
Which of the following is the best tool to identify the baseline distance staff travel through the day to
gather the materials they need to perform their job tasks?
- A. 5 whys
- B. spaghetti diagram
- C. Pareto chart
- D. time observation
Answer:
B
Explanation: A spaghetti diagram (B) maps staff travel paths to identify baseline distance,
highlighting layout inefficiencies. 5 whys (A), Pareto charts (C), and time observation (D) do not track
movement. NAHQ emphasizes spaghetti diagrams for Lean waste analysis.
Reference: NAHQ CPHQ Study Guide, Performance and Process Improvement Section, “Lean Tools
and Spaghetti Diagrams”; NAHQ CPHQ Practice Exam, Waste Reduction Strategies.
Question 12
The purpose of considering social determinants of health during quality improvement activities is to
achieve
- A. global health.
- B. community health.
- C. social justice.
- D. health equity.
Answer:
D
Explanation: Considering social determinants of health aims to achieve health equity (D), ensuring
fair health opportunities by addressing disparities. Global health (A), community health (B), and
social justice (C) are less specific. NAHQ prioritizes health equity for SDOH-focused improvement.
Reference: NAHQ CPHQ Study Guide, Population Health and Care Transitions Section, “Social
Determinants of Health and Health Equity”; NAHQ CPHQ Practice Questions, Population Health
Goals.
Question 13
A recent analysis reveals that reimbursement projection is being negatively impacted by post-
surgical respiratory failure rates. What is the first step to address this issue?
- A. Conduct a focus group with the anesthesiologists and nurse anesthetists.
- B. Conduct focused professional practice evaluation (FPPE) on the surgeons in the organization.
- C. Obtain a list of the patients identified by this code and conduct a retrospective review.
- D. Identify a team leader and facilitator to implement a quality improvement project.
Answer:
C
Explanation: A retrospective review of patients with post-surgical respiratory failure (C) identifies
root causes, informing interventions. Focus groups (A), FPPE (B), and team identification (D) follow
data analysis. NAHQ emphasizes data-driven root cause analysis as the first step.
Reference: NAHQ CPHQ Study Guide, Performance and Process Improvement Section, “Data Analysis
for Quality Issues”; NAHQ CPHQ Practice Exam, Clinical Outcome Improvement.
Question 14
A quality improvement team develops a new procedure for improving timeliness in reporting urgent
lab results to inpatient units. Prior to implementing the new procedure, the team wants to identify
any potential deviations from the desired procedure. Which of the following tools should the team
use to identify potential deviations?
- A. run chart
- B. interrelationship diagram
- C. matrix diagram
- D. process decision program chart
Answer:
D
Explanation: A process decision program chart (PDPC) (D) identifies potential deviations by mapping
process steps and contingency plans before implementation. Run charts (A), interrelationship
diagrams (B), and matrix diagrams (C) are less suited for pre-implementation risk analysis. NAHQ
highlights PDPC for proactive planning.
Reference: NAHQ CPHQ Study Guide, Performance and Process Improvement Section, “Process
Decision Program Chart for Risk Identification”; NAHQ CPHQ Practice Questions, Quality
Improvement Tools.
Question 15
When reviewing the outcome measures of five regional psychiatric centers, variables such as illness
severity, comorbid psychiatric and medical diagnoses, and substance-use issues are identified. Which
of the following methods best controls for these variables?
- A. case-mix adjustment
- B. analysis of variance
- C. weighted average
- D. Chi-square test
Answer:
A
Explanation: Case-mix adjustment (A) controls for variables like illness severity and comorbidities,
standardizing outcome comparisons across psychiatric centers. Analysis of variance (B), weighted
average (C), and Chi-square test (D) do not adjust for patient complexity. NAHQ emphasizes case-mix
adjustment for equitable comparisons.
Reference: NAHQ CPHQ Study Guide, Health Data Analytics Section, “Case-Mix Adjustment and
Outcome Measures”; NAHQ CPHQ Practice Exam, Statistical Methods for Quality Analysis.