cisco 500-420 Exam Questions
Questions for the 500-420 were updated on : Mar 07 ,2026
Page 1 out of 5. Viewing questions 1-15 out of 64
Question 1
Which statement is correct regarding controller-level and tier/node-level dashboards?
- A. The Performance Analyst can associate a controller-level dashboard with a tier or node through the My Dashboards tab
- B. From the controller-level dashboards list the Performance Analyst can access any tier/node-level dashboards outside the application in which they were created.
- C. Controller-level and tier/node-level dashboards are two separate sets. The Performance Analyst cannot cross-reference between these dashboards.
- D. Controller-level and tier/node-level dashboards are not scoped to be separate entities.
Answer:
C
Explanation:
Controller-level and tier/node-level dashboards in AppDynamics are treated as separate entities.
They are scoped differently, with controller-level dashboards providing a global view across the
entire AppDynamics domain, and tier/node-level dashboards being specific to particular tiers or
nodes within an application. Performance Analysts do not have the ability to cross-reference directly
between these two sets of dashboards within the AppDynamics UI.
Reference:
AppDynamics documentation on Dashboards: https://docs.appdynamics.com/latest/en/application-
monitoring/custom-dashboards
Question 2
Which three reports can be scheduled for periodic generation and delivery to email recipients?
(Choose three.)
- A. Ad Hoc Data
- B. Application Health
- C. Error Trends
- D. Custom Dashboard
- E. Controller Audit
- F. Tier List
Answer:
B, C, D
Explanation:
AppDynamics allows for several reports to be scheduled for periodic generation and sent to email
recipients. Among these, Application Health, Error Trends, and Custom Dashboards are types of
reports that can be automatically generated and delivered, providing regular insights into the
application's performance and issues.
Reference:
AppDynamics documentation on Reports: https://docs.appdynamics.com/latest/en/application-
monitoring/reporting
Question 3
The performance impact on the_______would lead a Performance Analyst to limit the duration and
frequency of automatic diagnostic sessions.
- A. Application
- B. Controller
- C. Network
- D. Operating System
Answer:
A
Explanation:
The primary concern for a Performance Analyst when considering the impact of automatic diagnostic
sessions is the application itself. Intensive diagnostic sessions can be resource-heavy, potentially
affecting the application's performance. Therefore, it is often necessary to limit the duration and
frequency of these sessions to ensure they do not negatively impact the application’s end-user
experience.
Reference:
AppDynamics documentation on Diagnostic Sessions:
https://docs.appdynamics.com/latest/en/troubleshoot/diagnostic-sessions
Question 4
Refer to Exhibit.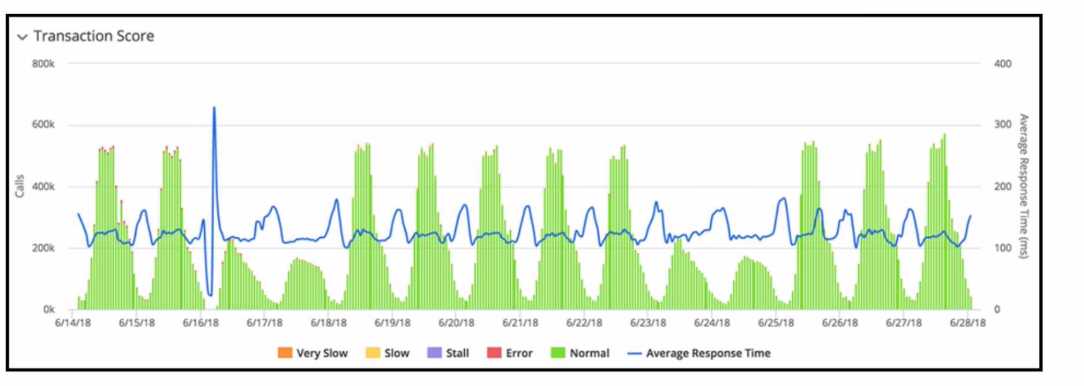
Refer to the exhibit. The transaction score in the graphic displays an interesting performance pattern
outside of business hours on 6/16/18. Which additional performance anomaly should be of most
interest to a Performance Analyst?
- A. Elevated Response Time at 6/19/18
- B. Elevated Response Time at 6/25/18
- C. Lower than usual volume at 6/17/18
- D. Low volume at 6/15/18
Answer:
A
Explanation:
The performance pattern outside of business hours on 6/16/18 that would be of most interest to a
Performance Analyst is the elevated response time, as indicated on 6/19/18. This is because it shows
a significant spike in response time, which could indicate a performance issue that needs to be
addressed. Anomalies in response time can often be more indicative of underlying problems than
changes in call volume, especially when they occur outside of expected peak periods.
Reference:
AppDynamics documentation on Transaction Score:
https://docs.appdynamics.com/latest/en/application-monitoring/application-
dashboard/transaction-score
Question 5
What must a Performance Analyst first configure in order to monitor end-to-end latency
performance metrics in AppDynamics?
- A. additional demarcator methods
- B. define the end-to-end latency transaction
- C. slow end-point identity markers
- D. endpoints for asynchronous transactions
Answer:
B
Explanation:
To monitor end-to-end latency performance metrics, a Performance Analyst must first define the
end-to-end latency transaction. This involves configuring the business transactions to include the
necessary entry and exit points that capture the complete flow of the transaction, thereby enabling
the measurement of the total latency.
Reference:
AppDynamics documentation on Business Transactions:
https://docs.appdynamics.com/latest/en/application-monitoring/business-transactions
Question 6
Which Application Dashboard view categorizes transactions by load, response time, errors, slow
transactions, and stalled transactions in a single aggregated value for a specific time range?
- A. Transaction Snapshots
- B. Top Business Transactions
- C. Machine Snapshots
- D. Transaction Score
Answer:
D
Explanation:
The Transaction Score view in the Application Dashboard categorizes transactions by load, response
time, errors, slow transactions, and stalled transactions. It provides an aggregated value for a specific
time range, giving an at-a-glance indication of the health and performance of business transactions.
Reference:
AppDynamics documentation on Transaction Score:
https://docs.appdynamics.com/latest/en/application-monitoring/application-dashboard
Question 7
Which statement about Service End Points and Business Transactions is true?
- A. Service End Points and Business Transactions can both be renamed by right clicking and selecting 'rename'.
- B. Service End Points and Business Transactions can both configure data collectors.
- C. Service End Points and Business Transactions can both be split.
- D. Service End Points and Business Transactions both provide percentile metrics.
Answer:
B
Explanation:
Both Service Endpoints and Business Transactions in AppDynamics have the capability to configure
data collectors. Data collectors are used to gather detailed information about transactions or
endpoints, such as method parameters, return values, and SQL statements.
Reference:
AppDynamics documentation on Data Collectors:
https://docs.appdynamics.com/latest/en/application-monitoring/configure-data-collection
Question 8
When should URI Segments be used in Transaction Detection rules?
- A. When identifying business transactions using particular parts of the SMTP request
- B. When the application uses message-oriented technologies
- C. When the application is a Web-Oriented Technology
- D. When the agent names the business transaction for the Web service name plus the operation name
Answer:
C
Explanation:
URI Segments should be used in Transaction Detection rules when the application is web-oriented.
Web-oriented applications often have meaningful information in the URI that can identify different
business transactions. URI Segments can help in defining patterns that match specific parts of the
URI to distinguish different transactions.
Reference:
AppDynamics documentation on Transaction Detection:
https://docs.appdynamics.com/latest/en/application-monitoring/business-transactions
Question 9
Which AppDynamics option will allow a Performance Analyst to compare and filter related servers
using custom metadata within your environment?
- A. Server Tagging
- B. Server Visibility
- C. Standalone Machine Agent
- D. Dynamic Monitoring Mode
Answer:
A
Explanation:
Server Tagging in AppDynamics allows a Performance Analyst to compare and filter related servers
by using custom metadata. This feature enables users to group and organize their servers based on
criteria that make sense for their environment, such as role, location, environment type, or any other
custom metadata.
Reference:
AppDynamics documentation on Server Tagging:
https://docs.appdynamics.com/latest/en/infrastructure-visibility/infrastructure-visibility-
settings/server-tags
Question 10
A Performance Analyst has a third-party event management system API and wants to use the event
management system to send alerts to Level 1.
Which actions are available in the AppDynamics Actions Menu to set this up?
- A. Send an SMS
- B. HTTP Request
- C. Remediation
- D. Send an Email
Answer:
B
Explanation:
When integrating with a third-party event management system, the Performance Analyst can set up
an HTTP Request action within AppDynamics. This allows for the creation of a custom HTTP request
to the event management system's API, which can be configured to send alerts to Level 1 support or
any other designated recipient.
Question 11
What is the Node limit of the maximum Service Endpoints per node?
- A. 50
- B. 100
- C. 250
- D. 1000
Answer:
B
Explanation:
AppDynamics imposes a limit on the number of Service Endpoints that can be registered per node to
ensure manageable performance and overhead. The limit per node is set to 100 Service Endpoints,
which is a balance between providing detailed monitoring and maintaining application performance.
Reference:
AppDynamics documentation on Service Endpoints:
https://docs.appdynamics.com/latest/en/application-monitoring/monitor-service-endpoints
Question 12
Which tab within the Application Dashboard displays performance trends for each of Snapshots,
Average Response Time, and Events within one central view?
- A. Application Flow Map
- B. Dashboard
- C. Events
- D. Transaction Score
- E. Network Dashboard
Answer:
D
Explanation:
The Transaction Score tab within the Application Dashboard is designed to display performance
trends across various metrics including Snapshots, Average Response Time, and Events. It gives a
comprehensive view of the transaction performance, providing a score that reflects the health and
reliability of transactions over time.
Reference:
AppDynamics documentation on Application Dashboard:
Question 13
A Performance Analyst needs to define a set of Key Performance Indicators (KPIs) from a group of
select metrics. The required performance information resides within the Transaction Analytics data
set. Which method will accomplish this task?
- A. Experience Level Management
- B. Search Queries
- C. Business Outcome Milestones
- D. Metric Explorer
Answer:
D
Explanation:
The Metric Explorer in AppDynamics allows Performance Analysts to define and visualize Key
Performance Indicators (KPIs) from a selection of metrics. By accessing the Transaction Analytics data
set, analysts can create custom dashboards that focus on the metrics they've determined to be
critical KPIs for their application's performance.
Reference:
AppDynamics documentation on Metric Explorer:
Question 14
Refer to exihibit.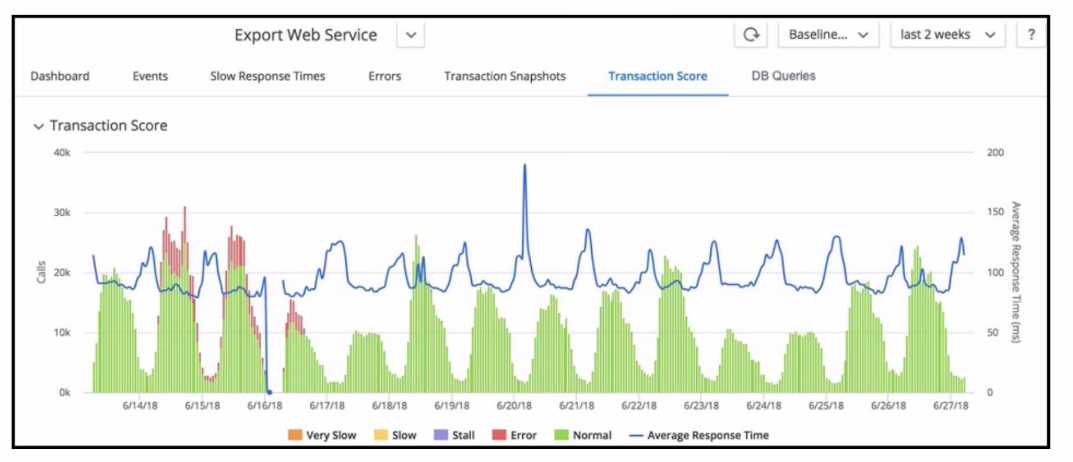
Refer to the exhibit. When looking at the Transaction Score for a specific transaction, how are errors
in the transaction identified?
- A. Set the time range and drill down into the snapshots in the Error tab.
- B. Set the time range and examine the Slow Response Times tab.
- C. Set the time range and examine the dashboard for errors.
- D. Set the time range and drill down into the snapshots in the Events tab.
Answer:
A
Explanation:
Errors in a transaction are identified by examining the snapshots that capture the problematic
transactions. By setting the appropriate time range, a Performance Analyst can drill down into the
snapshots within the Error tab to identify and analyze errors. These snapshots provide detailed
diagnostic information, such as stack traces, slow SQL queries, and error logs, which are vital for
pinpointing the root cause of transaction errors.
Reference:
AppDynamics documentation on Transaction Snapshots:
Question 15
Which three data points can be located by drilling down into a JDBC exit call for an Oracle backend?
(Choose three.)
- A. Query type
- B. Statement type
- C. Query Id
- D. Weight %
- E. Originating node
- F. %Time
Answer:
ABE
Explanation:
When drilling down into a JDBC exit call for an Oracle backend, AppDynamics provides detailed
information about the call. The data points include:
Query type, which can indicate whether it's a SELECT, INSERT, UPDATE, or DELETE statement.
Statement type, which describes the nature of the SQL statement being executed.
Originating node, which identifies the node from which the JDBC call originated.
These data points help in understanding the nature and source of database operations, which can be
critical for performance analysis and troubleshooting.
Reference:
AppDynamics documentation on Database Monitoring: